based on the above chart, which industrys average annual rate of change is projected to decrease the most in…
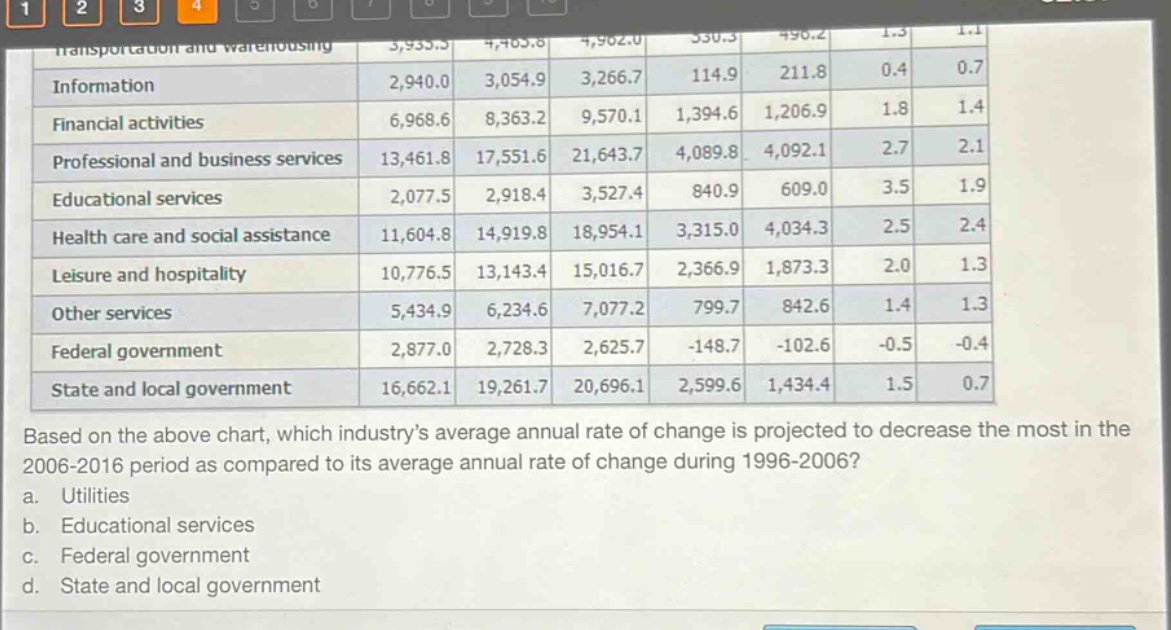
based on the above chart, which industrys average annual rate of change is projected to decrease the most in the 2006 - 2016 period as compared to its average annual rate of change during 1996 - 2006?\na. utilities\nb. educational services\nc. federal government\nd. state and local government
Answer
Explanation:
Step1: Identify the average annual rate of change for each industry in both periods
Utilities (assuming first row): 1.3 (1996-2006), 1.1 (2006-2016)
Educational services: 3.5 (1996-2006), 1.9 (2006-2016)
Federal government: -0.5 (1996-2006), -0.4 (2006-2016)
State and local government: 1.5 (1996-2006), 0.7 (2006-2016)
Step2: Calculate the decrease in rate of change
Utilities: (1.3 - 1.1 = 0.2)
Educational services: (3.5 - 1.9 = 1.6)
Federal government: (-0.5 - (-0.4) = -0.1) (increase, not decrease)
State and local government: (1.5 - 0.7 = 0.8)
Answer:
b. Educational services