based on the demand graph and the supply graph shown above, what is the price at the point of…
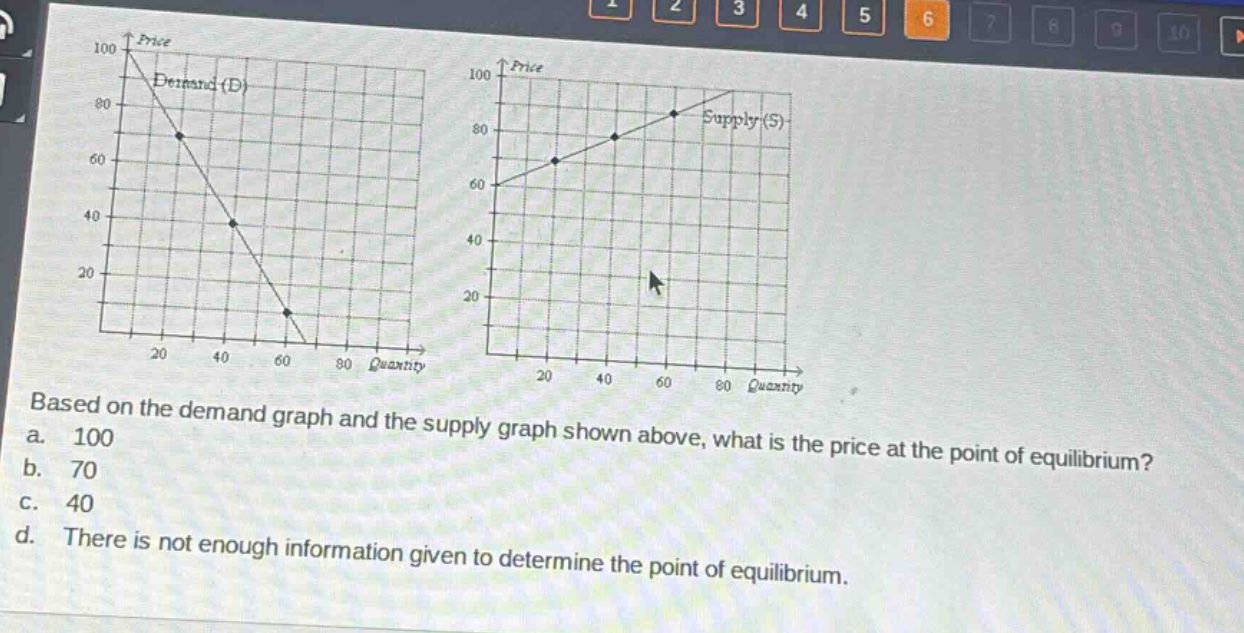
based on the demand graph and the supply graph shown above, what is the price at the point of equilibrium?\na. 100\nb. 70\nc. 40\nd. there is not enough information given to determine the point of equilibrium.
Answer
Explanation:
Step1: Recall equilibrium concept
Equilibrium occurs where demand equals supply. We need to find the intersection - point of the demand and supply curves on the graphs. But the two graphs are shown separately and there is no way to overlay them to find the intersection.
Answer:
d. There is not enough information given to determine the point of equilibrium.