based on this graph, which of the following describes the us economy of the early 1970s? the economy was…
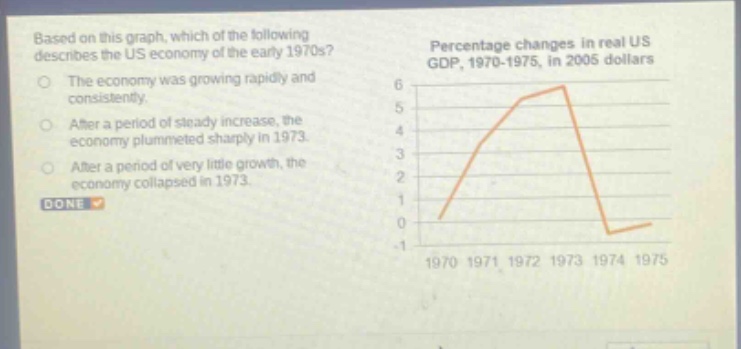
based on this graph, which of the following describes the us economy of the early 1970s? the economy was growing rapidly and consistently. after a period of steady increase, the economy plummeted sharply in 1973. after a period of very little growth, the economy collapsed in 1973. done percentage changes in real us gdp, 1970 - 1975, in 2005 dollars 6 5 4 3 2 1 0 -1 1970 1971 1972 1973 1974 1975
Answer
Answer:
After a period of steady increase, the economy plummeted sharply in 1973.
Explanation:
Step1: Observe the graph
The graph shows GDP percentage - change over years.
Step2: Analyze the trend
From 1970 - 1972, there is an upward trend (steady increase).
Step3: Identify the change in 1973
In 1973, there is a sharp decline in the percentage - change of GDP.