bolivia, labor force by occupation, 2010\nagriculture\nindustry\nservices\nwhat does the graph indicate…
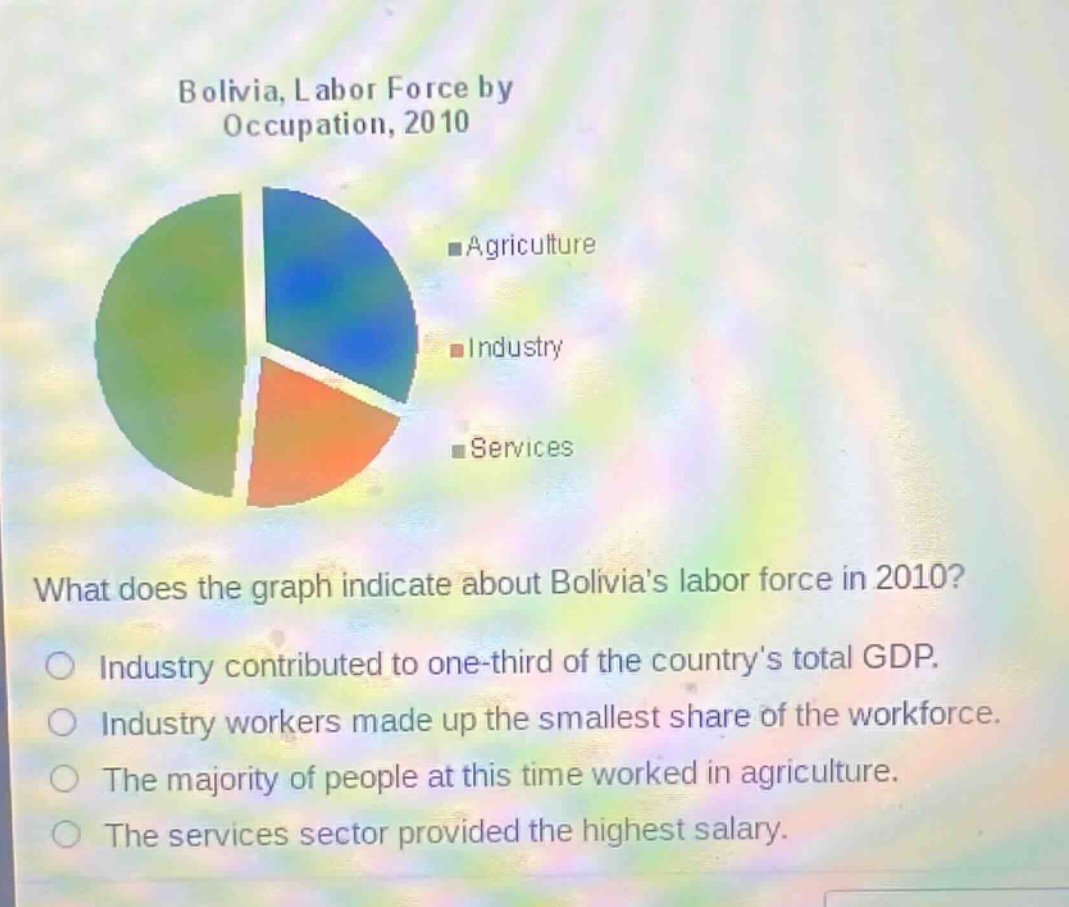
bolivia, labor force by occupation, 2010\nagriculture\nindustry\nservices\nwhat does the graph indicate about bolivias labor force in 2010?\nindustry contributed to one - third of the countrys total gdp.\nindustry workers made up the smallest share of the workforce.\nthe majority of people at this time worked in agriculture.\nthe services sector provided the highest salary.
Answer
Brief Explanations:
The pie - chart shows labor force by occupation in Bolivia in 2010. The smallest slice represents industry, indicating that industry workers made up the smallest share of the workforce. The chart does not provide information about GDP contribution or salaries.
Answer:
Industry workers made up the smallest share of the workforce.