changes in supply\nsample supply curve\nwhich events could cause the change in supply shown on this graph…
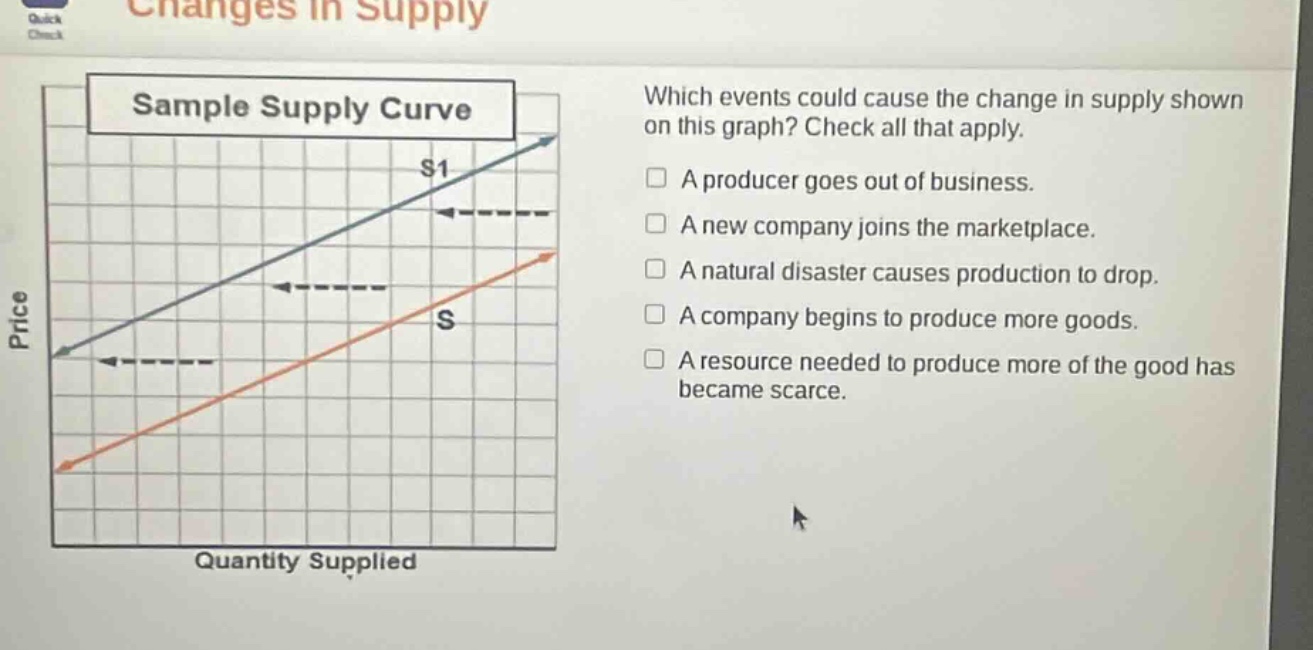
changes in supply\nsample supply curve\nwhich events could cause the change in supply shown on this graph? check all that apply.\n□ a producer goes out of business.\n□ a new company joins the marketplace.\n□ a natural disaster causes production to drop.\n□ a company begins to produce more goods.\n□ a resource needed to produce more of the good has became scarce.
Answer
Brief Explanations:
A left - shift in the supply curve indicates a decrease in supply. A producer going out of business reduces the number of suppliers, decreasing supply. A natural disaster causing production to drop also reduces the quantity that can be supplied. Scarce resources make it harder to produce more goods, leading to a decrease in supply. A new company joining the marketplace and a company producing more goods would increase supply, not decrease it as shown in the graph.
Answer:
A producer goes out of business. A natural disaster causes production to drop. A resource needed to produce more of the good has became scarce.