this chart shows the actual pricing history for three items.\nhistorical pricing for small - scale items\n|…
this chart shows the actual pricing history for three items.\nhistorical pricing for small - scale items\n| item | retail price | retail sale price | price 6 months later | auction price |\n| ---- | ---- | ---- | ---- | ---- |\n| game system | $249 | | $229 | $450 |\n| smart phone | $599 | | $399 | |\n| dvd | $24 | $16 | $19 | |\nfor which product(s) would it be most beneficial to wait before buying?\n○ game system\n○ smartphone\n○ dvd\n○ its most beneficial to buy all now.
Answer
Brief Explanations:
To determine which product is most beneficial to wait for before buying, we analyze the historical price changes for each item over 6 months.
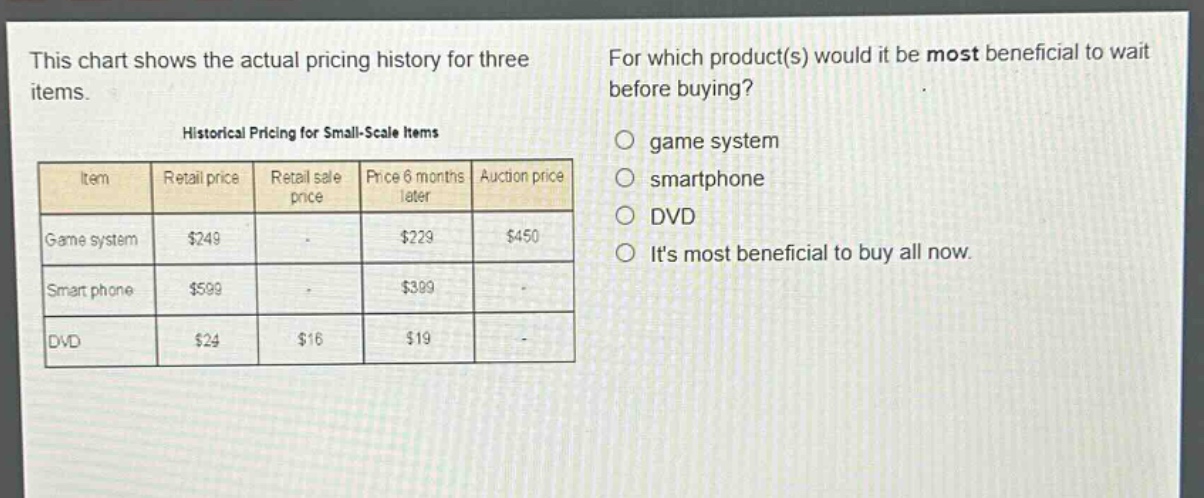
- Game system: The price decreased from $249 (Retail) to $229 after 6 months, a decrease of $20.
- Smartphone: The price decreased from $599 (Retail) to $399 after 6 months, a decrease of $200.
- DVD: The price decreased from $24 (Retail) to $16 (Sale), but then increased to $19 after 6 months (compared to the sale price). Compared to the original retail price, it decreased by $5 after 6 months.
The smartphone experienced the largest price drop ($200) over the 6-month period, indicating a strong downward trend. This suggests that waiting longer might lead to further price reductions, making it the most beneficial item to wait for.
Answer:
smartphone