the chart shows a combined supply and demand schedule. according to this table, what will happen when the…
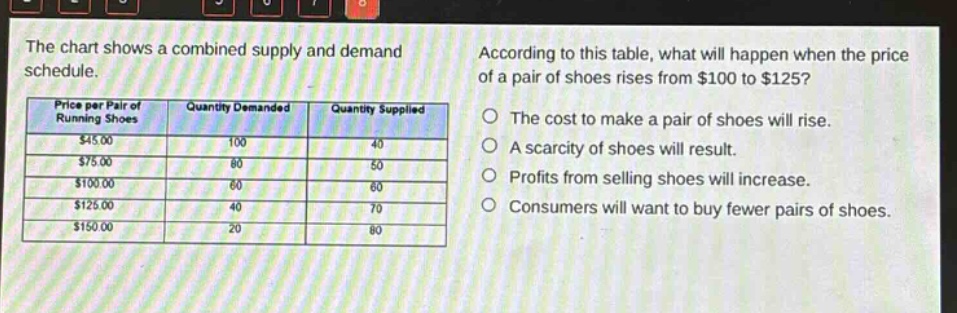
the chart shows a combined supply and demand schedule. according to this table, what will happen when the price of a pair of shoes rises from $100 to $125? price per pair of running shoes quantity demanded quantity supplied $45.00 100 40 $75.00 80 50 $100.00 60 60 $125.00 40 70 $150.00 20 80 the cost to make a pair of shoes will rise. a scarcity of shoes will result. profits from selling shoes will increase. consumers will want to buy fewer pairs of shoes.
Answer
Answer:
D. Consumers will want to buy fewer pairs of shoes.
Explanation:
Step1: Analyze demand - price relationship
According to the law of demand, as price increases, quantity demanded decreases.
Step2: Check table data
When price rises from $100 to $125, quantity demanded drops from 60 to 40. So consumers want to buy fewer pairs of shoes.