the chart below shows the economic costs of two school lunches. the smallest price difference between the…
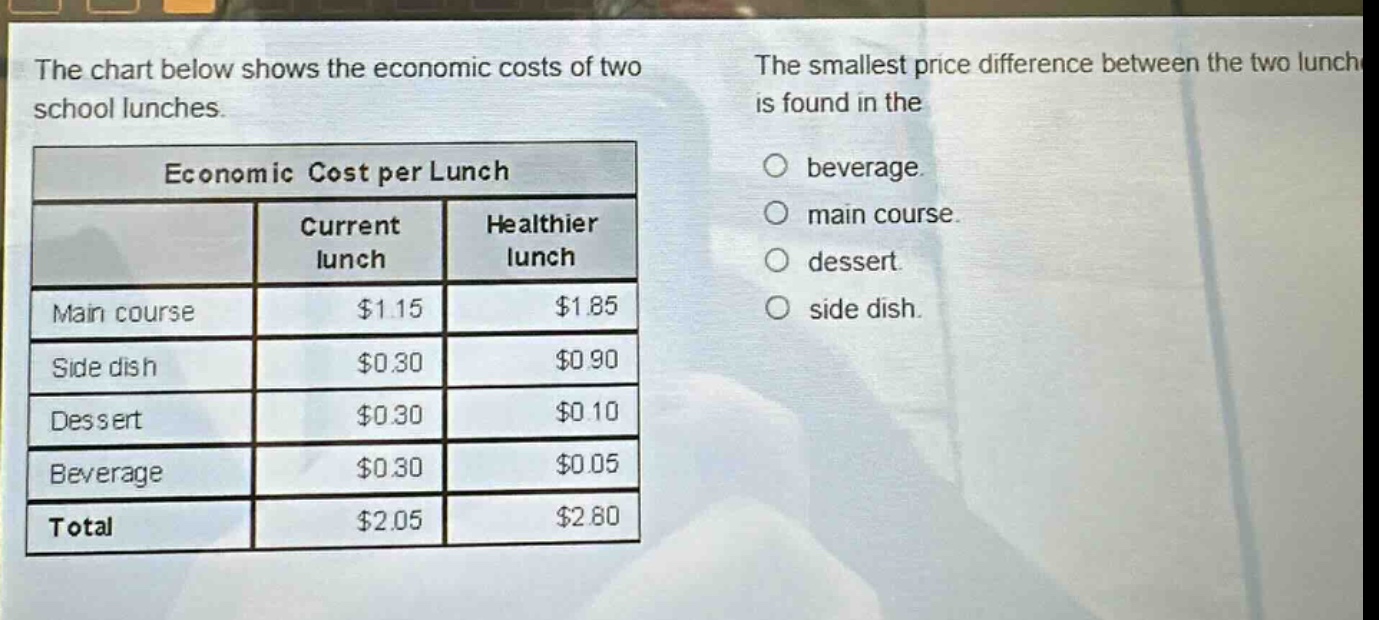
the chart below shows the economic costs of two school lunches. the smallest price difference between the two lunches is found in the\nbeverage.\nmain course.\ndessert.\nside dish.\n\neconomic cost per lunch\n| | current lunch | healthier lunch |\n|--|--|--| \n| main course | $1.15 | $1.85 |\n| side dish | $0.30 | $0.90 |\n| dessert | $0.30 | $0.10 |\n| beverage | $0.30 | $0.05 |\n| total | $2.05 | $2.80 |
Answer
Explanation:
Step1: Calcular diferencias de precios
Main course: $|1.15 - 1.85|= 0.7$ Side dish: $|0.30 - 0.90| = 0.6$ Dessert: $|0.30 - 0.10|=0.2$ Beverage: $|0.30 - 0.05| = 0.25$
Answer:
dessert