the chart below shows an exchange rate table. what is the most likely conclusion that can be drawn about how…
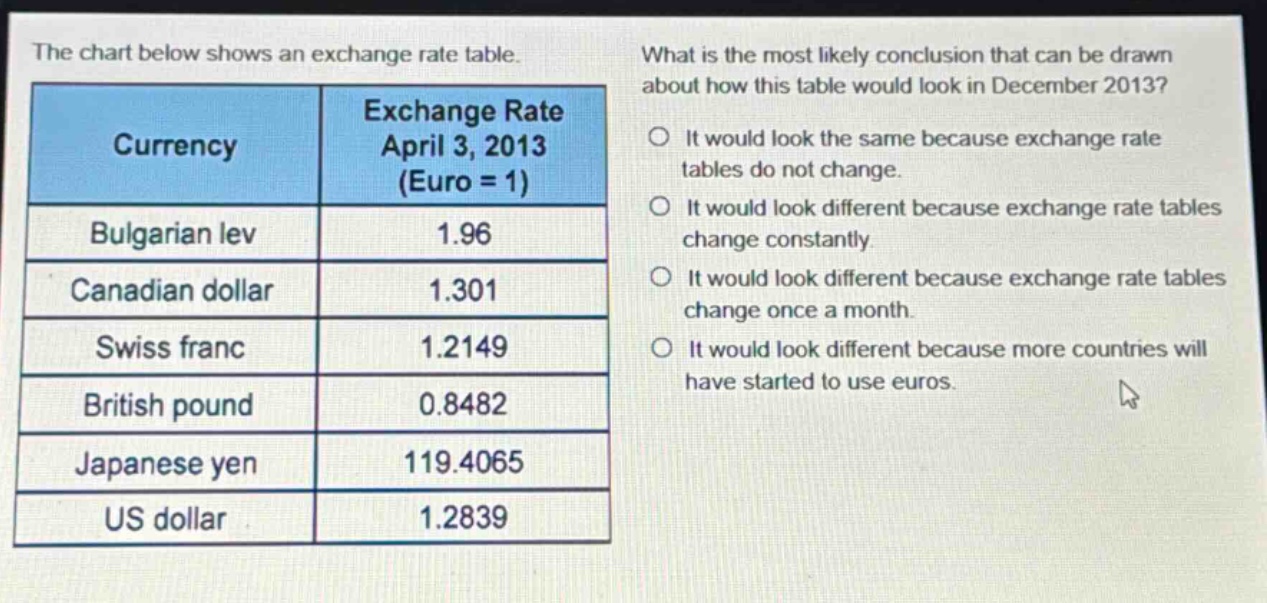
the chart below shows an exchange rate table. what is the most likely conclusion that can be drawn about how this table would look in december 2013? currency exchange rate april 3, 2013 (euro = 1) bulgarian lev 1.96 canadian dollar 1.301 swiss franc 1.2149 british pound 0.8482 japanese yen 119.4065 us dollar 1.2839 it would look the same because exchange rate tables do not change. it would look different because exchange rate tables change constantly. it would look different because exchange rate tables change once a month. it would look different because more countries will have started to use euros.
Answer
Brief Explanations:
Exchange rates are influenced by various economic factors like interest - rate differentials, inflation, and economic growth. These factors are constantly changing, so exchange rate tables change constantly.
Answer:
It would look different because exchange rate tables change constantly.