chelsea has an electronics business. during her first year in the business, she collected data on different…
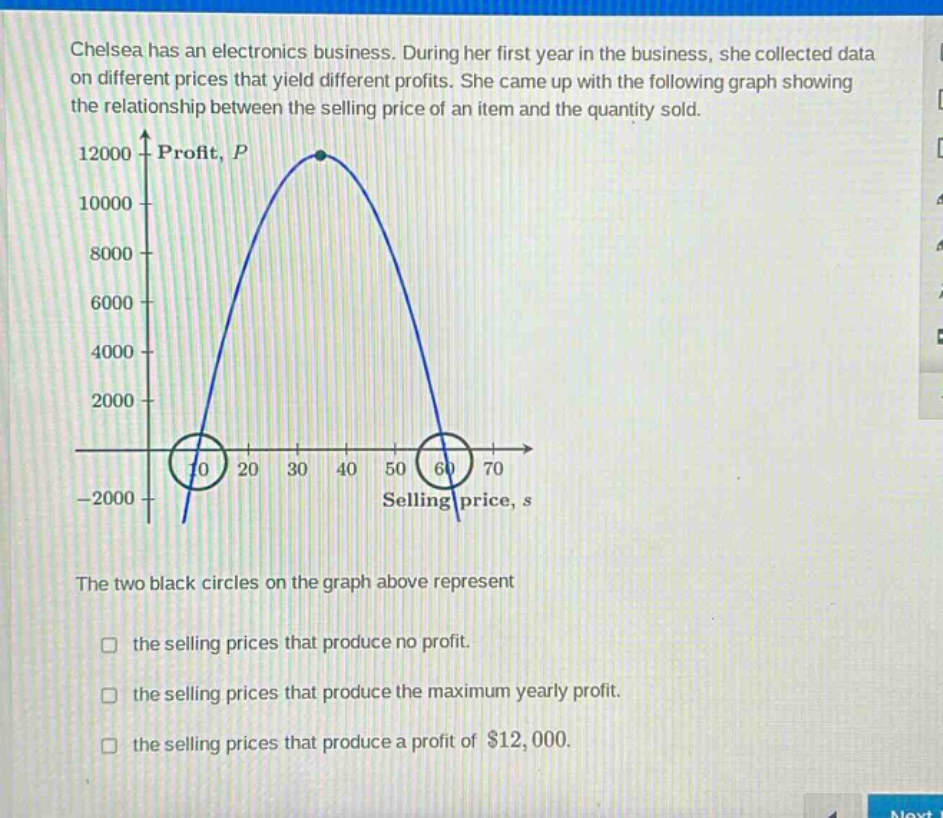
chelsea has an electronics business. during her first year in the business, she collected data on different prices that yield different profits. she came up with the following graph showing the relationship between the selling price of an item and the quantity sold. the two black circles on the graph above represent the selling prices that produce no profit. the selling prices that produce the maximum yearly profit. the selling prices that produce a profit of $12,000.
Answer
Brief Explanations:
The profit - selling price graph shows that at the points where the graph intersects the selling - price axis (where profit $P = 0$), the selling prices are $s = 10$ and $s=60$. These are the break - even points where there is no profit. The maximum profit is at the vertex of the parabola (around $s = 35$ with $P = 12000$). The circles are at the $x$ - intercepts of the profit function.
Answer:
the selling prices that produce no profit.