a collector’s item is purchased for $150 and its value increases by 3% each year. which graph can be used to…
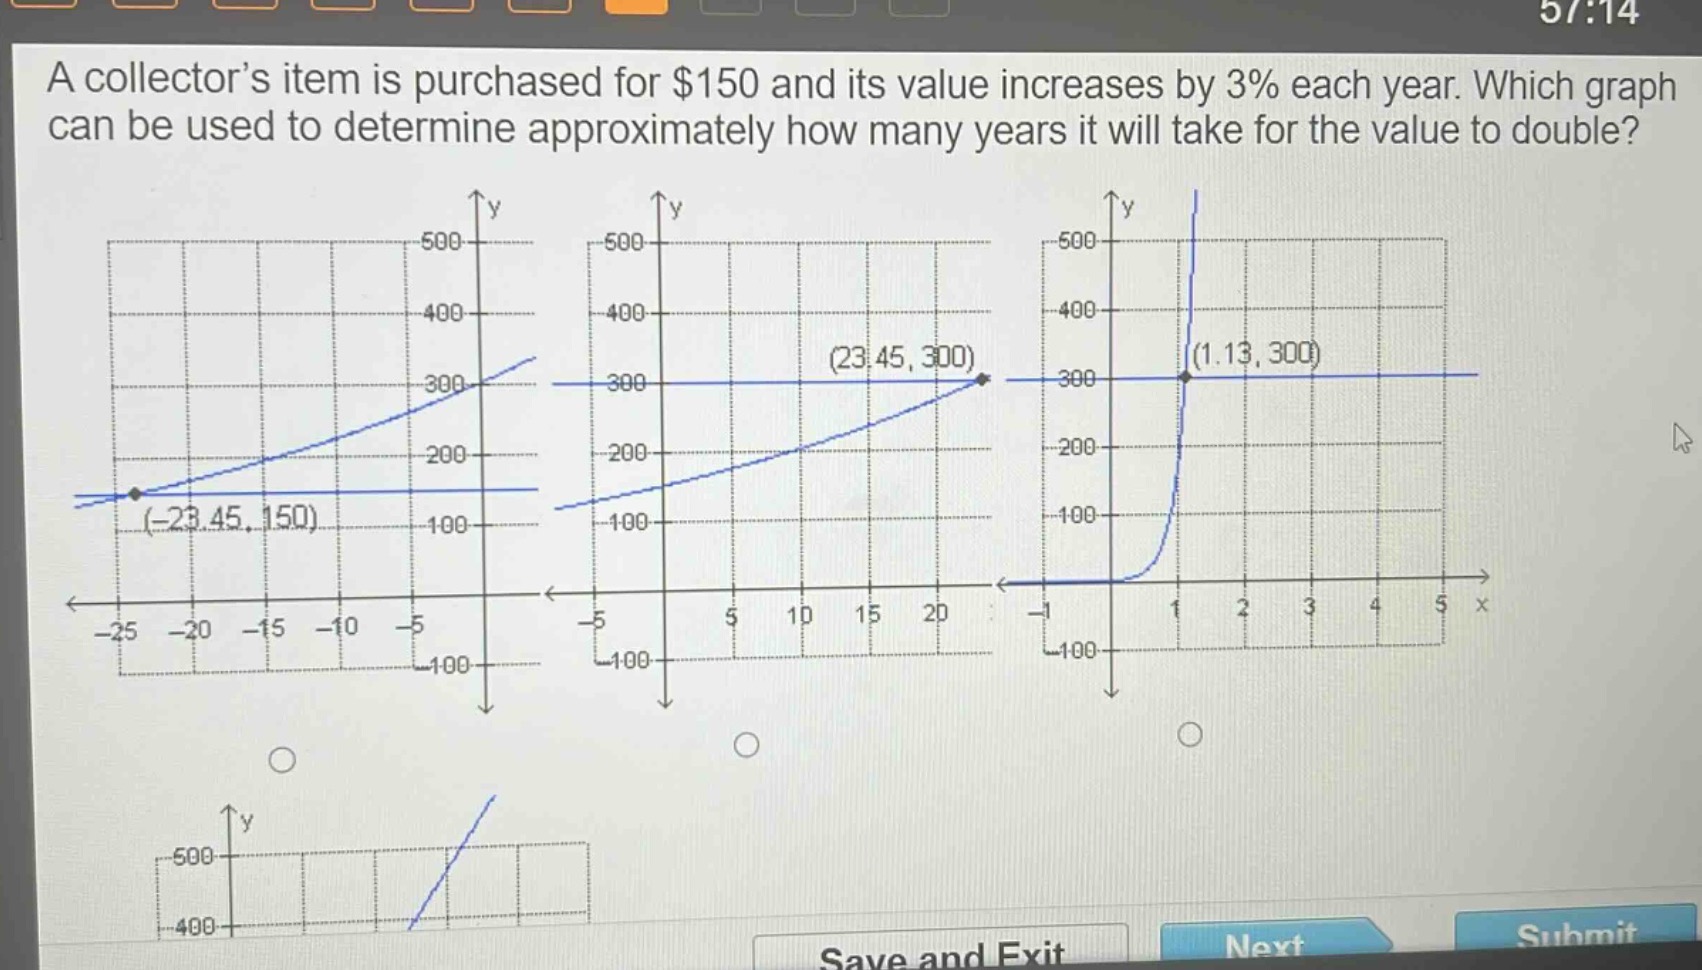
a collector’s item is purchased for $150 and its value increases by 3% each year. which graph can be used to determine approximately how many years it will take for the value to double?
Answer
Answer:
The second - graph (the one with the point ((23.45,300)))
Explanation:
Step1: Write the compound - growth formula
The formula for compound growth is (y = a(1 + r)^x), where (a=$150) is the initial value, (r = 0.03) is the growth rate, and (x) is the number of years. We want to find (x) when (y = 300) (since the value doubles from (150) to (300)). So, (300=150(1 + 0.03)^x).
Step2: Simplify the equation
Divide both sides of the equation (300 = 150(1.03)^x) by (150). We get (2=(1.03)^x).
Step3: Analyze the graphs
We are looking for a graph where the (y) - value is (300) and the corresponding (x) - value is the number of years it takes for the value to double. The first graph has a negative (x) - value for (y = 150) which is not possible for time (years). The third graph has an (x) - value of (1.13) when (y = 300) which is incorrect as per our calculation. The second graph has an (x) - value of approximately (23.45) when (y = 300), which is consistent with solving (2=(1.03)^x) (using logarithms: (x=\frac{\ln(2)}{\ln(1.03)}\approx23.45)).