what conclusion should be drawn from the graph?\ntrade has minimal impact on gdp.\ntrade increased between…
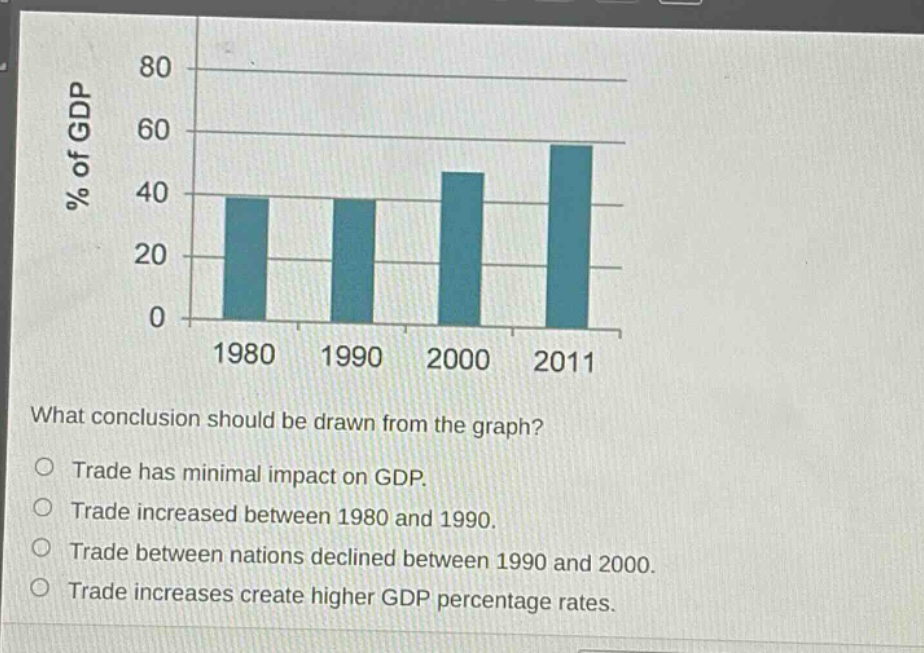
what conclusion should be drawn from the graph?\ntrade has minimal impact on gdp.\ntrade increased between 1980 and 1990.\ntrade between nations declined between 1990 and 2000.\ntrade increases create higher gdp percentage rates.
Answer
Brief Explanations:
The graph shows the percentage of GDP related to trade increasing from 1980 - 2011. This indicates that as trade increases, the percentage of GDP it represents also rises. The first option is wrong as the graph shows trade has a significant impact. The second option is incorrect as trade did not increase between 1980 - 1990. The third option is false as trade increased between 1990 - 2000.
Answer:
Trade increases create higher GDP percentage rates.