the cost of pie production\npies produced per day total cost marginal cost\n0 pies $0.00 $0.00\n1 pie $1.00…
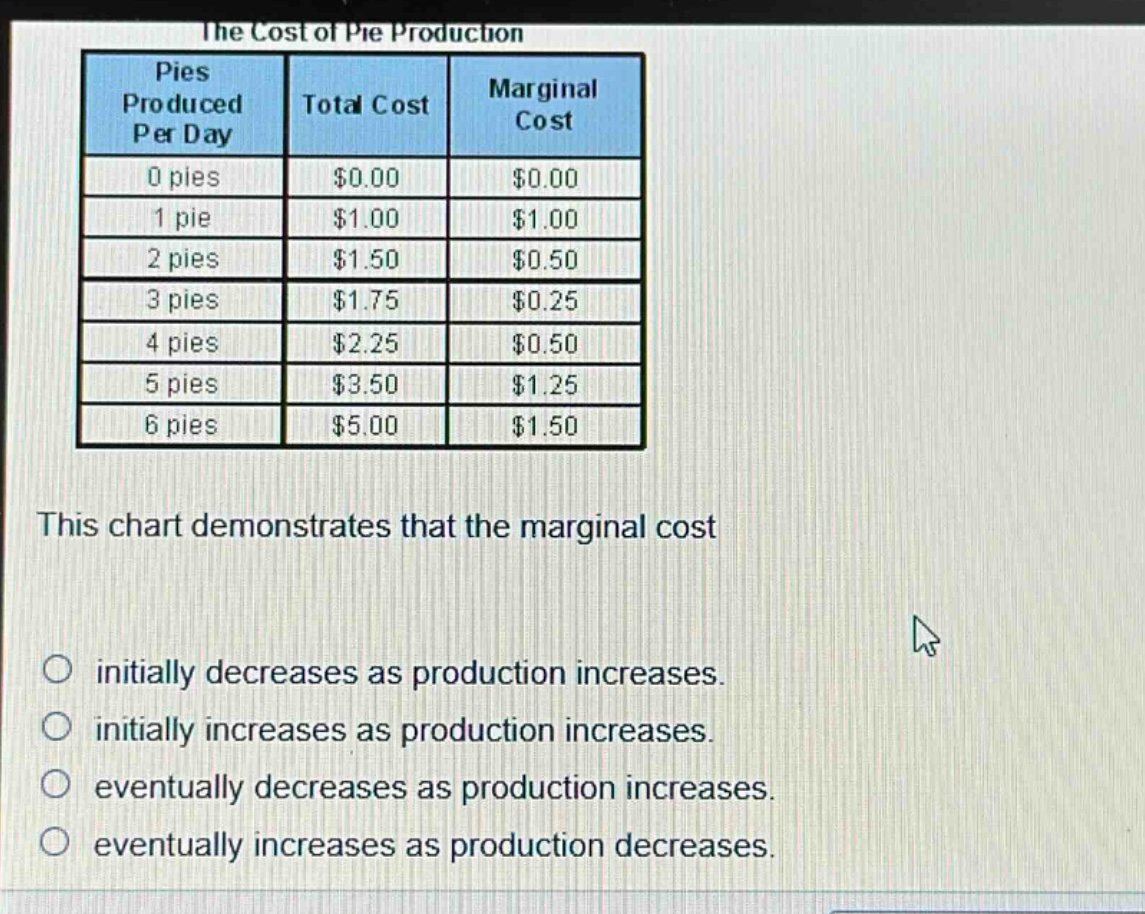
the cost of pie production\npies produced per day total cost marginal cost\n0 pies $0.00 $0.00\n1 pie $1.00 $1.00\n2 pies $1.50 $0.50\n3 pies $1.75 $0.25\n4 pies $2.25 $0.50\n5 pies $3.50 $1.25\n6 pies $5.00 $1.50\nthis chart demonstrates that the marginal cost\ninitially decreases as production increases.\ninitially increases as production increases.\neventually decreases as production increases.\neventually increases as production decreases.
Answer
Explanation:
Step1: Analyze marginal - cost values
When production goes from 0 to 1 pie, marginal cost is $1.00. From 1 to 2 pies, it is $0.50. From 2 to 3 pies, it is $0.25.
Step2: Observe the trend
The marginal - cost values are $1.00, $0.50, $0.25 for the initial increases in production (from 0 to 3 pies).
Step3: Determine the trend conclusion
The marginal cost initially decreases as production increases.
Answer:
initially decreases as production increases.