the data in the table represents a companys profit based on the number of items produced. which equation…
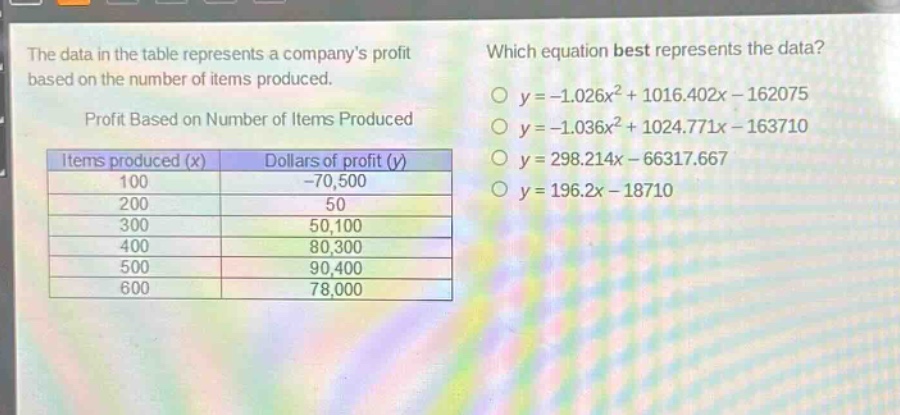
the data in the table represents a companys profit based on the number of items produced. which equation best represents the data? profit based on number of items produced items produced (x) dollars of profit (y) 100 -70,500 200 50 300 50,100 400 80,300 500 90,400 600 78,000 y = -1.026x² + 1016.402x - 162075 y = -1.036x² + 1024.771x - 163710 y = 298.214x - 66317.667 y = 196.2x - 18710
Answer
Explanation:
Step1: Substitute x = 100 into each equation
For $y=-1.026x^{2}+1016.402x - 162075$:
$y=-1.026\times100^{2}+1016.402\times100 - 162075=-10260 + 101640.2-162075=-70694.8$
For $y=-1.036x^{2}+1024.771x - 163710$:
$y=-1.036\times100^{2}+1024.771\times100 - 163710=-10360+102477.1 - 163710=-71592.9$
For $y = 298.214x-66317.667$:
$y=298.214\times100-66317.667=29821.4 - 66317.667=-36496.267$
For $y = 196.2x-18710$:
$y=196.2\times100-18710=19620 - 18710 = 910$ The actual value when $x = 100$ is $y=-70500$. The first - equation $y=-1.026x^{2}+1016.402x - 162075$ gives a value closest to the actual value. We can double - check with another value, say $x = 200$.
Step2: Substitute x = 200 into the first equation
For $y=-1.026x^{2}+1016.402x - 162075$: $y=-1.026\times200^{2}+1016.402\times200 - 162075=-1.026\times40000+203280.4 - 162075=-41040+203280.4 - 162075 = 174.4$ which is also relatively close to the actual value of $y = 50$ when $x = 200$.
Answer:
$y=-1.026x^{2}+1016.402x - 162075$