determining the appearance of a graph\nleticia invests $200 at 5% interest. if y represents the amount of…
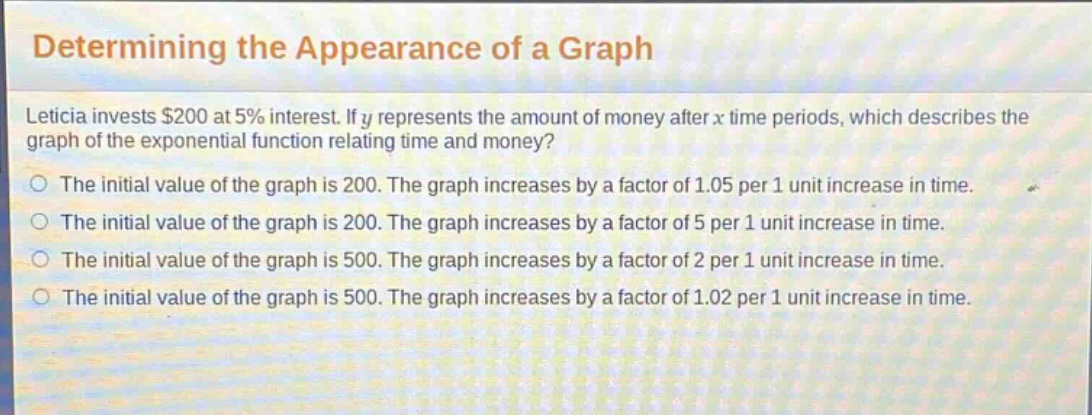
determining the appearance of a graph\nleticia invests $200 at 5% interest. if y represents the amount of money after x time periods, which describes the graph of the exponential function relating time and money?\nthe initial value of the graph is 200. the graph increases by a factor of 1.05 per 1 unit increase in time.\nthe initial value of the graph is 200. the graph increases by a factor of 5 per 1 unit increase in time.\nthe initial value of the graph is 500. the graph increases by a factor of 2 per 1 unit increase in time.\nthe initial value of the graph is 500. the graph increases by a factor of 1.02 per 1 unit increase in time.
Answer
Explanation:
Step1: Identify initial - value
The initial investment is $200, so the initial value of the graph (when $x = 0$) is 200.
Step2: Determine the growth - factor
The interest rate is 5% or 0.05. The formula for compound - growth is $y=a(1 + r)^x$, where $a$ is the initial amount, $r$ is the interest rate, and $x$ is the number of time periods. Here, $1+r=1 + 0.05=1.05$, so the graph increases by a factor of 1.05 per 1 unit increase in time.
Answer:
The initial value of the graph is 200. The graph increases by a factor of 1.05 per 1 unit increase in time.