during an economic crisis, the average value of homes in a community of 36 homes lost $9368 with a standard…
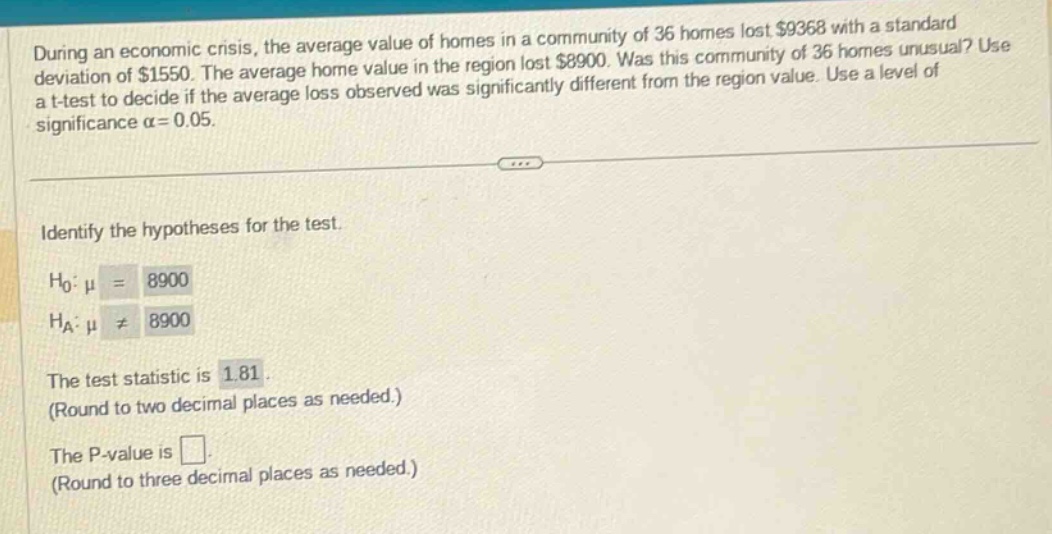
during an economic crisis, the average value of homes in a community of 36 homes lost $9368 with a standard deviation of $1550. the average home value in the region lost $8900. was this community of 36 homes unusual? use a t - test to decide if the average loss observed was significantly different from the region value. use a level of significance α = 0.05. identify the hypotheses for the test. h0: μ = 8900 ha: μ ≠ 8900 the test statistic is 1.81. (round to two decimal places as needed.) the p - value is. (round to three decimal places as needed.)
Answer
Explanation:
Step1: Determine degrees of freedom
The degrees of freedom for a one - sample t - test with sample size $n = 36$ is $df=n - 1=36-1 = 35$.
Step2: Calculate the p - value
Since this is a two - tailed t - test with $t = 1.81$ and $df = 35$, we use the t - distribution table or a calculator with t - distribution functions. Using a calculator (e.g., TI - 84: 2*tcdf(1.81,1E99,35)), we find the p - value. The p - value is $2\times(1 - P(T_{35}<1.81))$. Looking up in the t - distribution table or using software, $P(T_{35}<1.81)\approx0.955$, so the p - value is $2\times(1 - 0.955)=0.090$.
Answer:
$0.090$