in the figure to the right, the movement from point a to point b in the money market would be caused by\na…
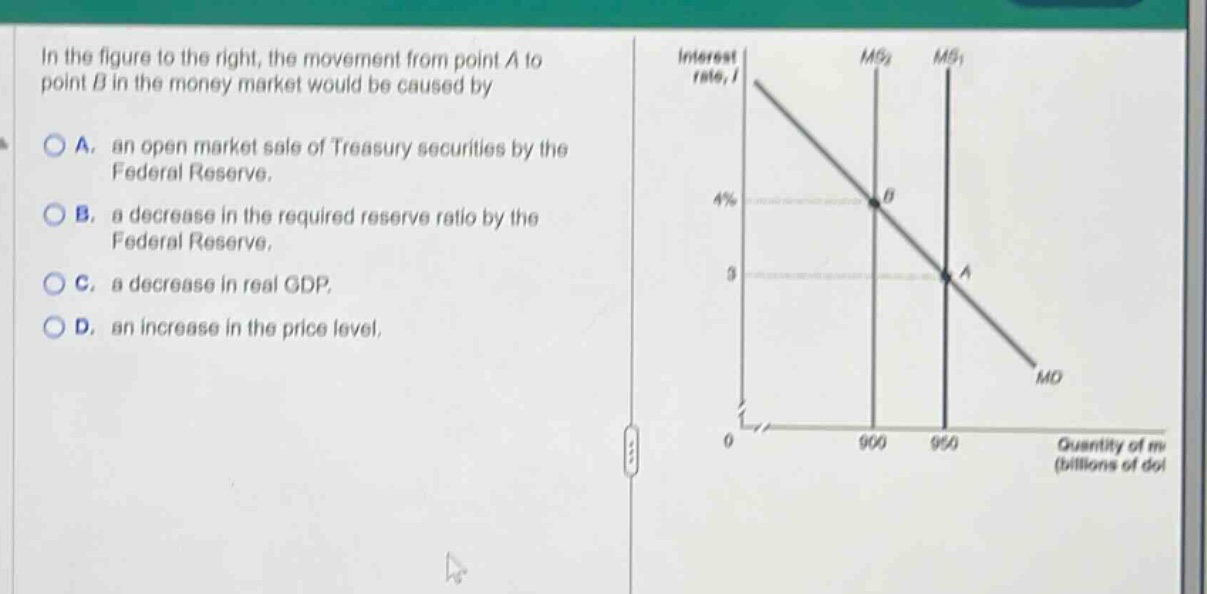
in the figure to the right, the movement from point a to point b in the money market would be caused by\na. an open market sale of treasury securities by the federal reserve.\nb. a decrease in the required reserve ratio by the federal reserve.\nc. a decrease in real gdp.\nd. an increase in the price level.
Answer
Brief Explanations:
- An open - market sale of Treasury securities by the Federal Reserve reduces the money supply. In the money - market graph, a decrease in the money supply shifts the money - supply curve to the left, which is consistent with the movement from point A to point B (higher interest rate and lower quantity of money).
- A decrease in the required reserve ratio increases the money supply, shifting the money - supply curve to the right.
- A decrease in real GDP reduces the demand for money, not the supply, and would cause a movement along the money - supply curve due to a change in the interest rate.
- An increase in the price level increases the demand for money, not the supply, and would cause a movement along the money - supply curve due to a change in the interest rate.
Answer:
A. an open market sale of Treasury securities by the Federal Reserve