the following graph displays the cost and revenue functions for jakes homemade wicker baskets. how many…
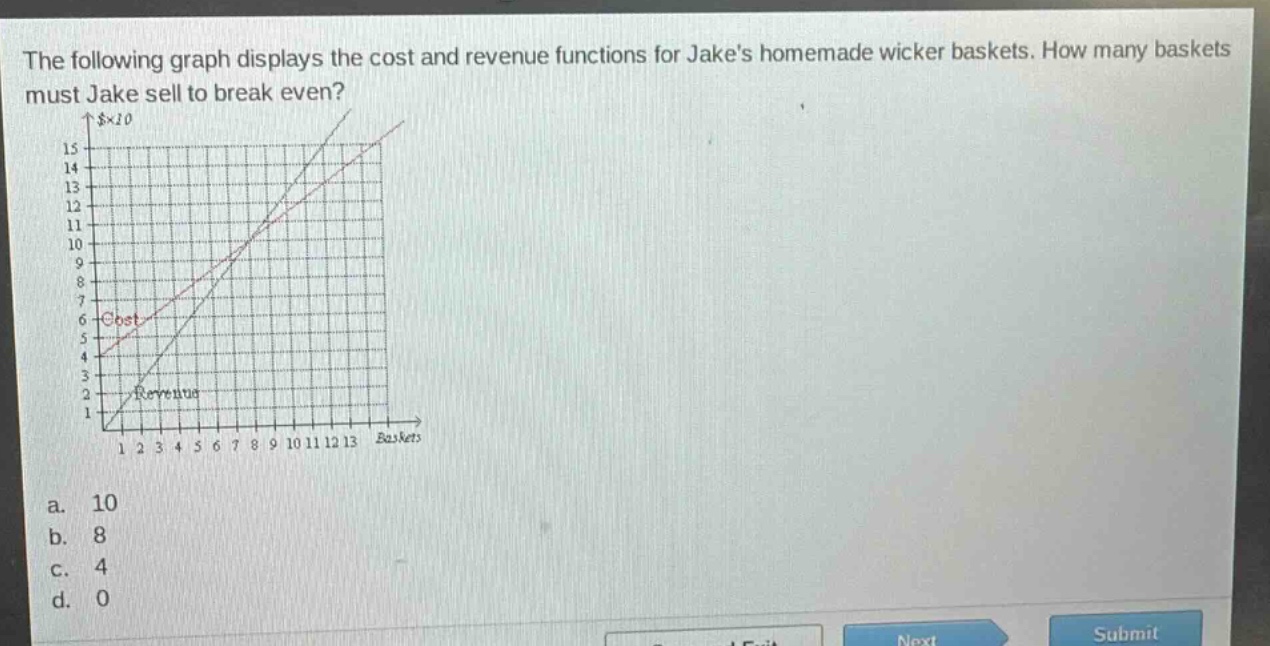
the following graph displays the cost and revenue functions for jakes homemade wicker baskets. how many baskets must jake sell to break even? a. 10 b. 8 c. 4 d. 0
Answer
Explanation:
Step1: Understand break - even point
The break - even point is where cost equals revenue, i.e., the intersection of the cost and revenue functions on the graph.
Step2: Locate intersection on graph
By observing the graph, the cost and revenue functions intersect at the point where the number of baskets is 8.
Answer:
B. 8