the following table shows the revenue for a company generates based on the increases in the price of the…
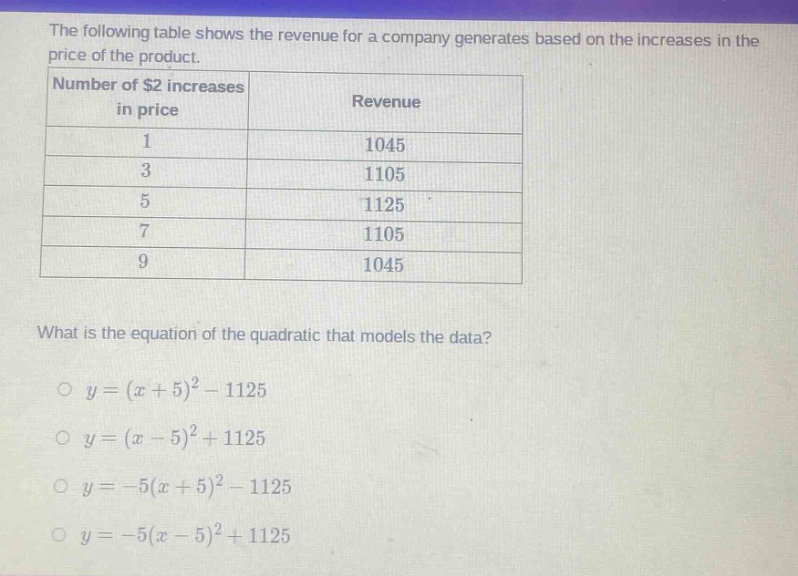
the following table shows the revenue for a company generates based on the increases in the price of the product.\n|number of $2 increases in price|revenue|\n|----|----|\n|1|1045|\n|3|1105|\n|5|1125|\n|7|1105|\n|9|1045|\nwhat is the equation of the quadratic that models the data?\no $y=(x + 5)^2-1125$\no $y=(x - 5)^2+1125$\no $y=-5(x + 5)^2-1125$\no $y=-5(x - 5)^2+1125$
Answer
Explanation:
Step1: Recall vertex - form of quadratic
The vertex - form of a quadratic function is $y=a(x - h)^2 + k$, where $(h,k)$ is the vertex of the parabola.
Step2: Identify the vertex
The vertex of a parabola (in a revenue - price relationship) occurs at the maximum of the revenue. Looking at the table, the maximum revenue is $1125$ when the number of $$2$ increases in price $x = 5$. So the vertex $(h,k)=(5,1125)$.
Step3: Determine the value of $a$
We can use a point from the table, say $(x = 1,y = 1045)$. Substitute $x = 1$, $y = 1045$, $h = 5$ and $k = 1125$ into $y=a(x - h)^2 + k$. $1045=a(1 - 5)^2+1125$. $1045=a(-4)^2+1125$. $1045 = 16a+1125$. $16a=1045 - 1125=-80$. $a=- 5$.
Step4: Write the quadratic equation
Substitute $a=-5$, $h = 5$ and $k = 1125$ into $y=a(x - h)^2 + k$. We get $y=-5(x - 5)^2+1125$.
Answer:
$y=-5(x - 5)^2+1125$