a function that models the profit for a new pet - monitoring system shows that there is no profit made until…
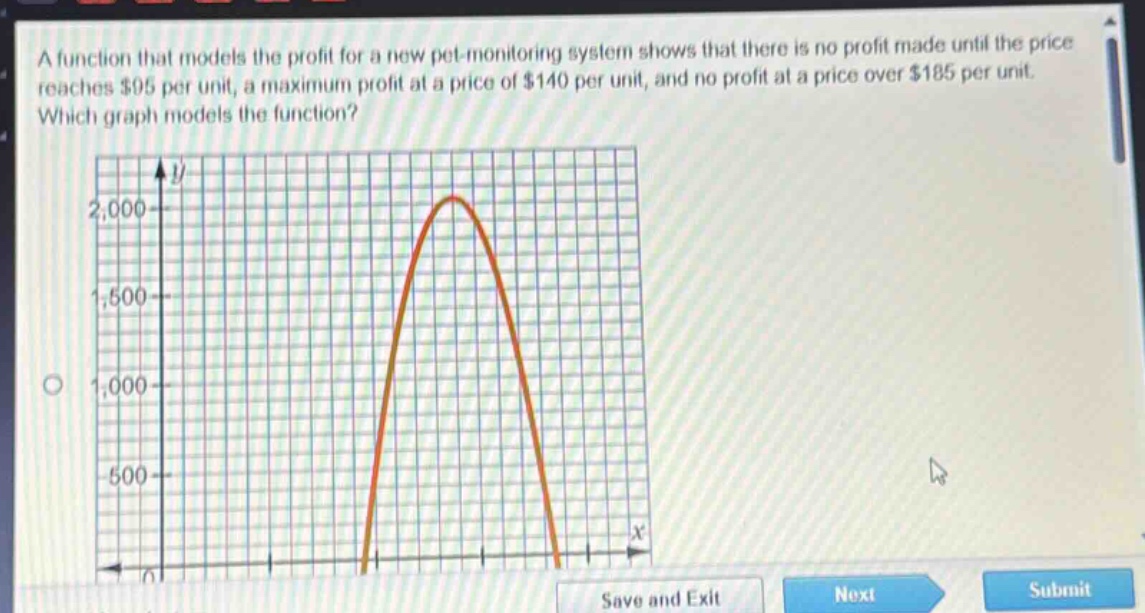
a function that models the profit for a new pet - monitoring system shows that there is no profit made until the price reaches $95 per unit, a maximum profit at a price of $140 per unit, and no profit at a price over $185 per unit. which graph models the function?
Answer
Explanation:
Step 1: Identify conditions from the problem statement.
The problem describes a profit function with the following characteristics:
- No profit is made until the price reaches $95 per unit. This means profit $P(x) = 0$ at $x = 95$.
- A maximum profit occurs at a price of $140 per unit. This means the x-coordinate of the vertex of the profit function (a parabola) is $x = 140$.
- No profit is made at a price over $185 per unit. This means profit $P(x) = 0$ at $x = 185$. These conditions imply a downward-opening parabolic function. The points $(95, 0)$ and $(185, 0)$ are the x-intercepts. The vertex of the parabola is at $(140, P_{max})$.
Step 2: Determine the scale of the graph axes.
From the provided graph:
- The x-axis has major grid lines at intervals of $50 (0, 50, 100, 150, ...)$. There are 5 minor grid lines between major ones. So, each minor grid line on the x-axis represents $\frac{50}{5} = 10$ units.
- The y-axis has major grid lines at intervals of $500 (0, 500, 1000, 1500, ...)$. There are 5 minor grid lines between major ones. So, each minor grid line on the y-axis represents $\frac{500}{5} = 100$ units.
Step 3: Locate x-intercepts on the graph.
We check where the graph intersects the x-axis (where profit is zero):
- The first x-intercept is located to the left of the $100 mark. It is halfway between the $90 mark (9th minor grid line from 0) and the $100 mark (10th minor grid line from 0). This corresponds to $x = 95$. This matches the first condition ($P(95)=0$).
- The second x-intercept is located between the $150 mark and the $200 mark. It is at $150 + 3.5 \text{ minor grid lines} = 150 + 3.5 \times 10 = 150 + 35 = 185$. This corresponds to $x = 185$. This matches the third condition ($P(185)=0$).
Step 4: Locate the vertex on the graph.
We check the location of the maximum point (vertex) of the parabola:
- The x-coordinate of the vertex is where the maximum profit occurs. On the graph, the parabola's peak is at $x = 140$. This can be seen as $100 + 4 \text{ minor grid lines} = 100 + 4 \times 10 = 140$, or $150 - 1 \text{ minor grid line} = 150 - 1 \times 10 = 140$. This matches the second condition that maximum profit occurs at $x=140$.
- The y-coordinate of the vertex (maximum profit) is approximately $2025$. This is $2000 + \frac{1}{4} \times 100 = 2025$. The problem does not specify the value of the maximum profit, only the price at which it occurs, so this is consistent.
Step 5: Compare graph features with problem conditions.
The x-intercepts of the graphed parabola are at $x=95$ and $x=185$. The x-coordinate of the vertex is at $x=140$. These features perfectly match all the conditions described in the problem statement.
Answer:
The provided graph models the function.