this is a graph of the business cycle. time is measured along the x - axis. what is measured along the y…
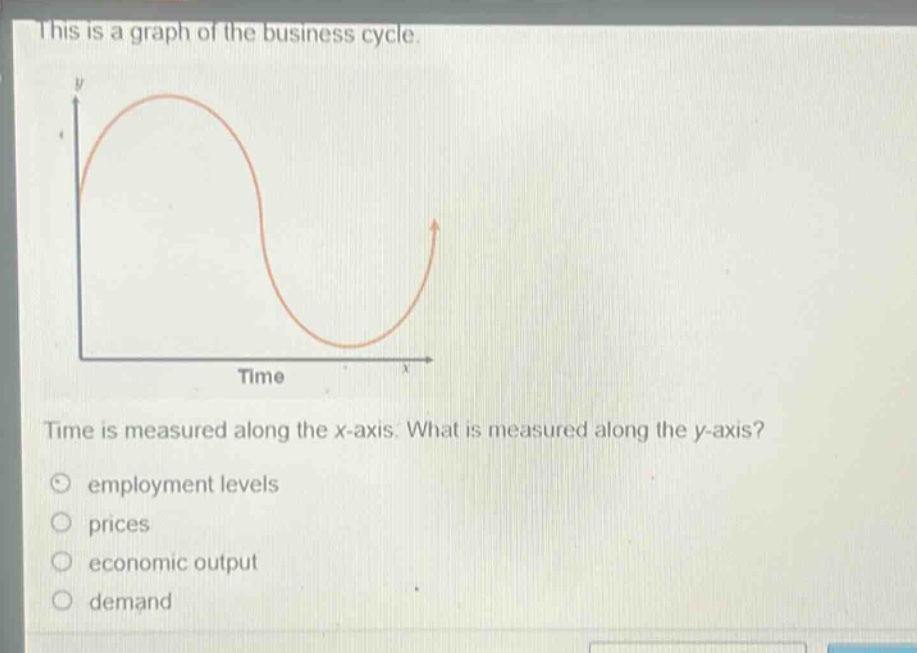
this is a graph of the business cycle. time is measured along the x - axis. what is measured along the y - axis? employment levels prices economic output demand
Answer
Brief Explanations:
In a business - cycle graph, the x - axis represents time and the y - axis typically represents economic output which shows the level of production in an economy over time. Employment levels, prices, and demand can be related to the business cycle but are not the primary variable measured on the y - axis of a standard business - cycle graph.
Answer:
C. economic output