this is a graph of the business cycle. time is measured along the x - axis. what is measured along the y…
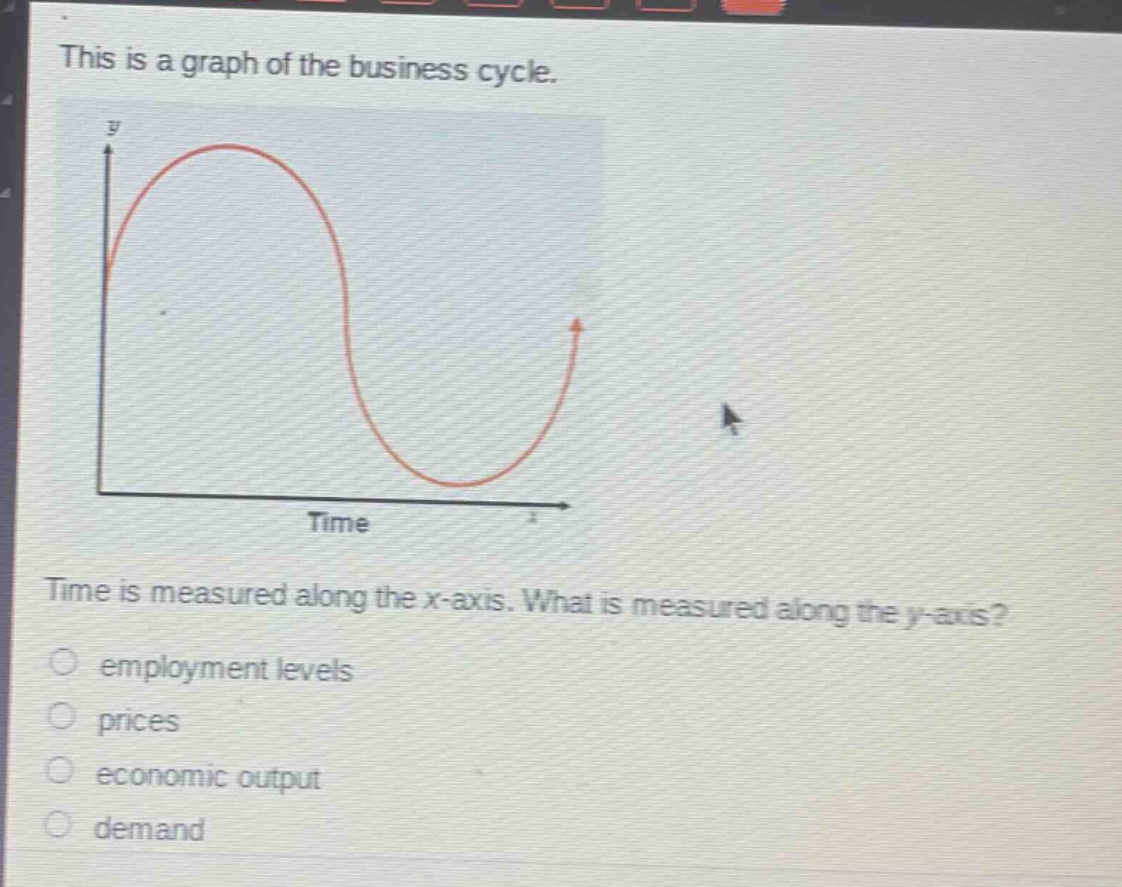
this is a graph of the business cycle. time is measured along the x - axis. what is measured along the y - axis?\nemployment levels\nprices\neconomic output\ndemand
Answer
Brief Explanations:
In a business - cycle graph, the x - axis represents time and the y - axis commonly represents economic output, which measures the total amount of goods and services produced in an economy over a period. Employment levels, prices, and demand can be related to the business cycle but are not the primary variable measured on the y - axis of a standard business - cycle graph.
Answer:
C. economic output