the graph examines the market for graphic t - shirts. based on the graph, which event could cause the change…
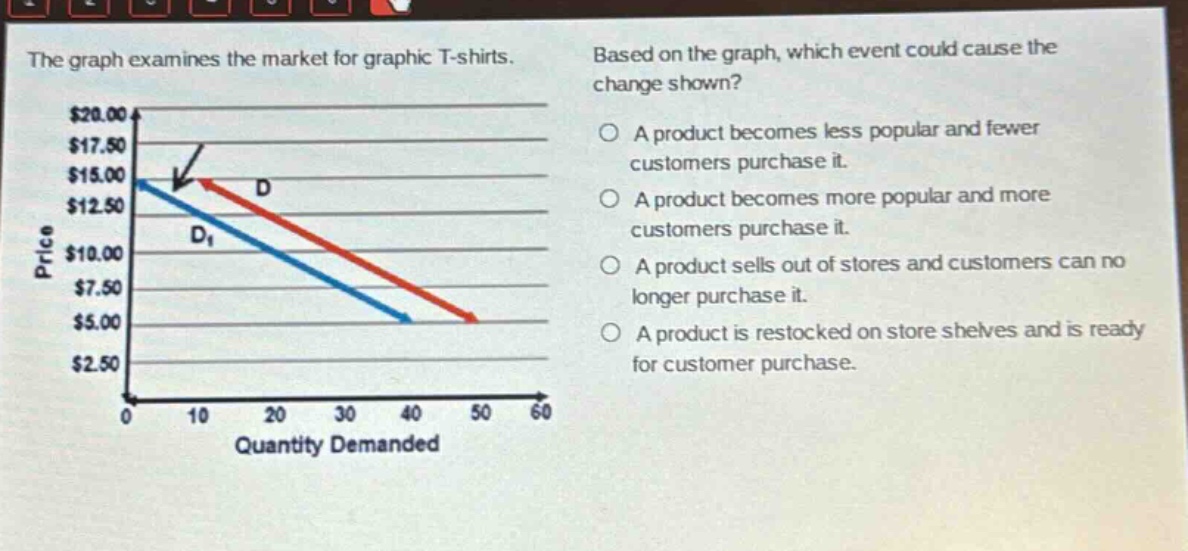
the graph examines the market for graphic t - shirts. based on the graph, which event could cause the change shown? a product becomes less popular and fewer customers purchase it. a product becomes more popular and more customers purchase it. a product sells out of stores and customers can no longer purchase it. a product is restocked on store shelves and is ready for customer purchase.
Answer
Brief Explanations:
The graph shows a left - ward shift of the demand curve (from D to D1), which indicates a decrease in demand. When a product becomes less popular and fewer customers purchase it, demand decreases, causing the demand curve to shift left - ward. Other options either increase demand (product becomes more popular), are not related to demand shifts (product sells out or is restocked in terms of demand curve movement).
Answer:
A. A product becomes less popular and fewer customers purchase it.