on this graph, what does the green arrow represent?\no an ineffective price floor set above equilibrium…
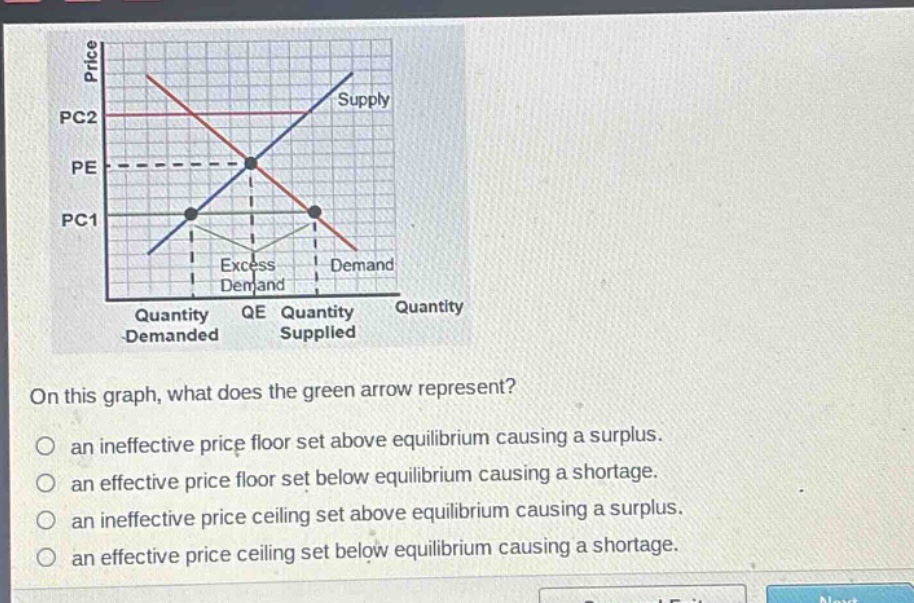
on this graph, what does the green arrow represent?\no an ineffective price floor set above equilibrium causing a surplus.\no an effective price floor set below equilibrium causing a shortage.\no an ineffective price ceiling set above equilibrium causing a surplus.\no an effective price ceiling set below equilibrium causing a shortage.
Answer
Answer:
an effective price ceiling set below equilibrium causing a shortage.
Brief Explanation:
A price - ceiling is a maximum price. When it is set below the equilibrium price (PC1 < PE), quantity demanded exceeds quantity supplied, creating a shortage. This is an effective price - ceiling as it impacts the market equilibrium.