on this graph, what does the green arrow represent?\n○ an ineffective price floor set above equilibrium…
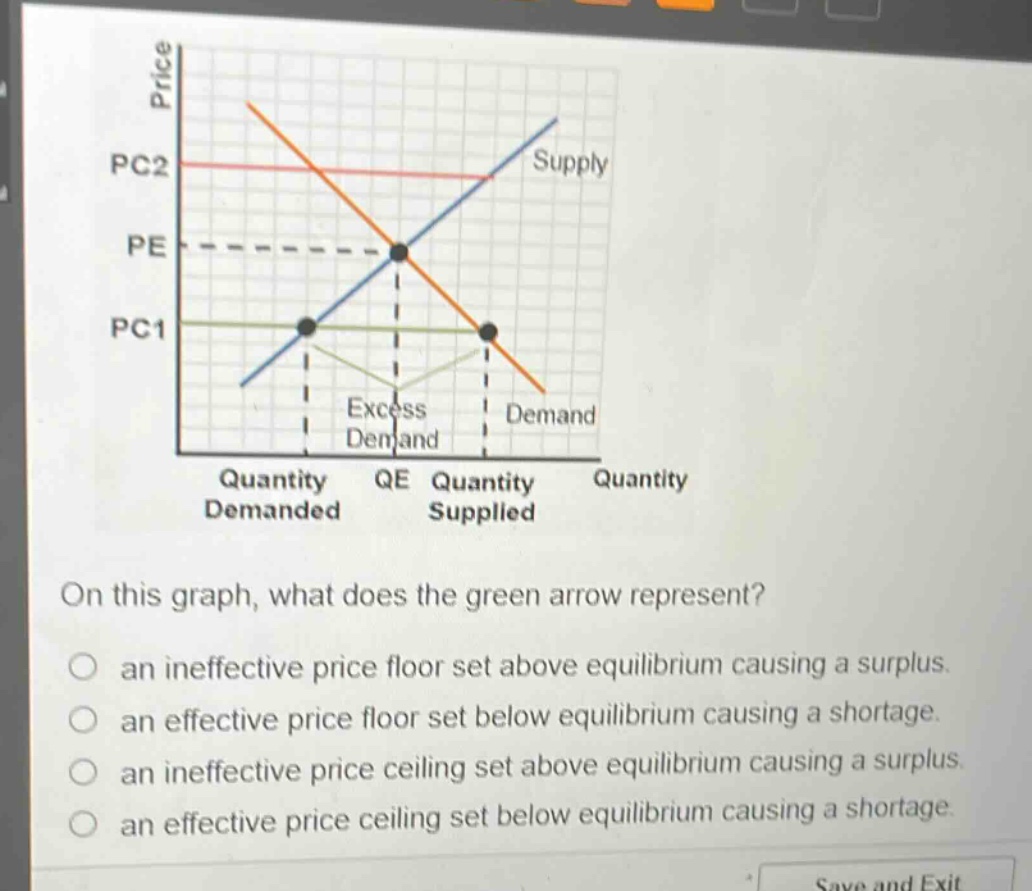
on this graph, what does the green arrow represent?\n○ an ineffective price floor set above equilibrium causing a surplus.\n○ an effective price floor set below equilibrium causing a shortage.\n○ an ineffective price ceiling set above equilibrium causing a surplus.\n○ an effective price ceiling set below equilibrium causing a shortage.
Answer
Brief Explanations:
A price - ceiling is a legal maximum price. When it is set below the equilibrium price (PE), quantity demanded exceeds quantity supplied, creating a shortage. In the graph, PC1 is a price - ceiling set below the equilibrium price PE, resulting in excess demand (shortage). An effective price - ceiling has an impact on the market, while an ineffective one is set above the equilibrium and has no impact. A price - floor is a legal minimum price. Here, the green arrow represents a situation where the price is capped at PC1 below PE, which is an effective price - ceiling causing a shortage.
Answer:
an effective price ceiling set below equilibrium causing a shortage.