the graph represents the balance on harrisons car loan in the months since purchasing the car. which…
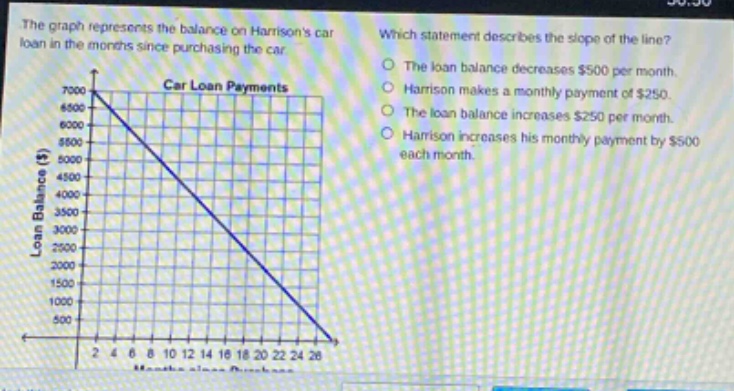
the graph represents the balance on harrisons car loan in the months since purchasing the car. which statement describes the slope of the line? the loan balance decreases $500 per month. harrison makes a monthly payment of $250. the loan balance increases $250 per month. harrison increases his monthly payment by $500 each month. car loan payments loan balance ($) 7000 6500 6000 5500 5000 4500 4000 3500 3000 2500 2000 1500 1000 500 0 2 4 6 8 10 12 14 16 18 20 22 24 26 months since purchase
Answer
Explanation:
Step1: Identify slope concept
The slope of a line in a loan - balance vs time graph represents the rate of change of the loan balance per unit time (month in this case). A negative slope means the balance is decreasing over time.
Step2: Analyze the graph
The line is decreasing. To find the rate of change, we can pick two points. Let's assume the initial balance (at month 0) is around $7000$ and at month 14, the balance is around $0$. The change in balance $\Delta y=7000 - 0=7000$ and the change in months $\Delta x = 14$. The slope $m=\frac{\Delta y}{\Delta x}=\frac{7000}{14}=500$. Since the balance is decreasing, the slope is - 500, which means the loan balance decreases by $500$ per month.
Answer:
The loan balance decreases $500 per month.