the graph represents the direct variation function between earnings in dollars and hours worked. which…
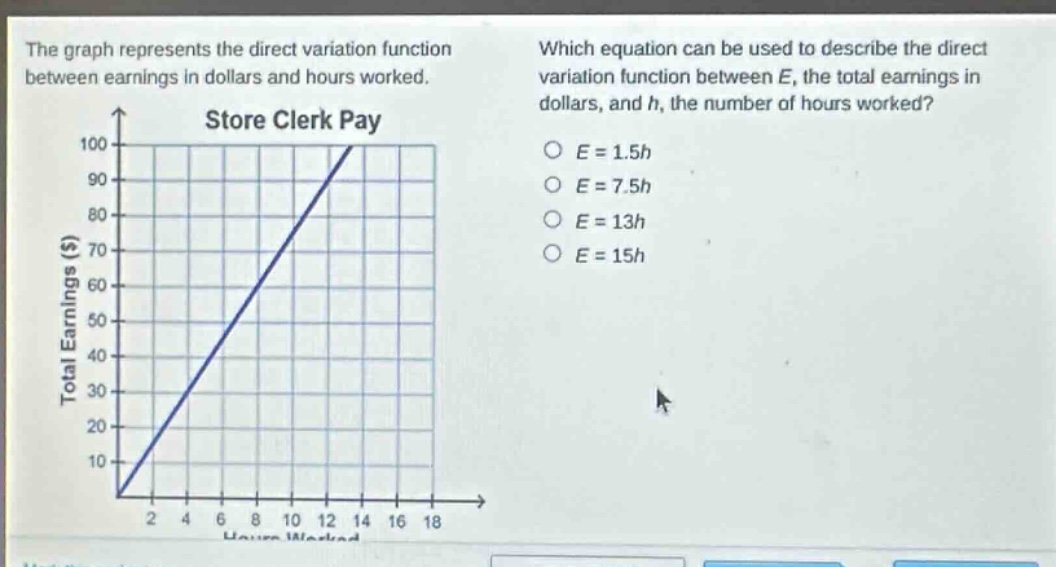
the graph represents the direct variation function between earnings in dollars and hours worked. which equation can be used to describe the direct variation function between e, the total earnings in dollars, and h, the number of hours worked? store clerk pay total earnings ($) 100 90 80 70 60 50 40 30 20 10 0 2 4 6 8 10 12 14 16 18 hours worked o e = 1.5h o e = 7.5h o e = 13h o e = 15h
Answer
Explanation:
Step1: Identify the form of the equation.
The problem states it's a direct variation function between earnings $E$ and hours worked $h$. The general form is $E = kh$, where $k$ is the constant of variation.
Step2: Find the constant of variation $k$.
Select a point from the graph, for example, $(4, 30)$. Substitute $h=4$ and $E=30$ into the equation $E = kh$. $$30 = k \times 4$$ Solve for $k$: $$k = \frac{30}{4} = 7.5$$
Step3: Write the equation.
Substitute the value of $k$ back into the general form: $$E = 7.5h$$
Answer:
B. $E = 7.5h$