the graph represents the expected hourly revenue, in dollars, y, earned by a car wash for each decrease of x…
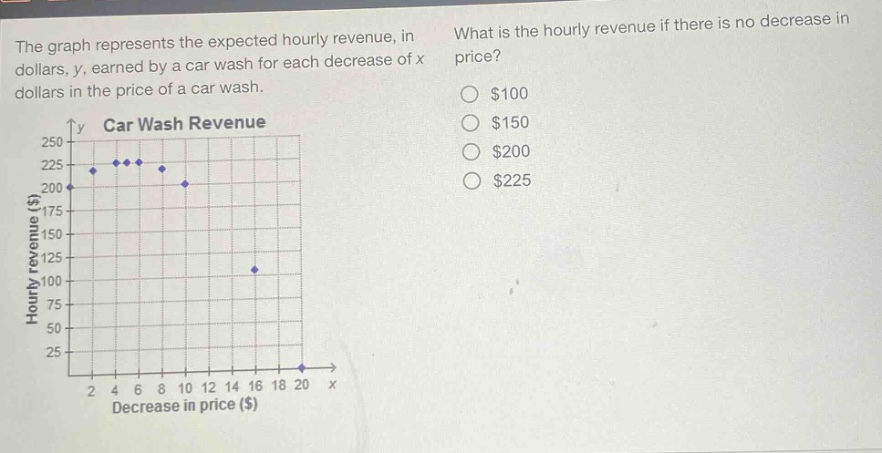
the graph represents the expected hourly revenue, in dollars, y, earned by a car wash for each decrease of x dollars in the price of a car wash. what is the hourly revenue if there is no decrease in price? $100 $150 $200 $225
Answer
Answer:
D. $225
Explanation:
Step1: Identify x - value
When there is no decrease in price, $x = 0$.
Step2: Locate on graph
Find $x = 0$ on the x - axis of the graph. The corresponding y - value (hourly revenue) is at $y=225$.