the graph represents the fees in thousands of dollars, y, depending on the amount invested in millions, x…
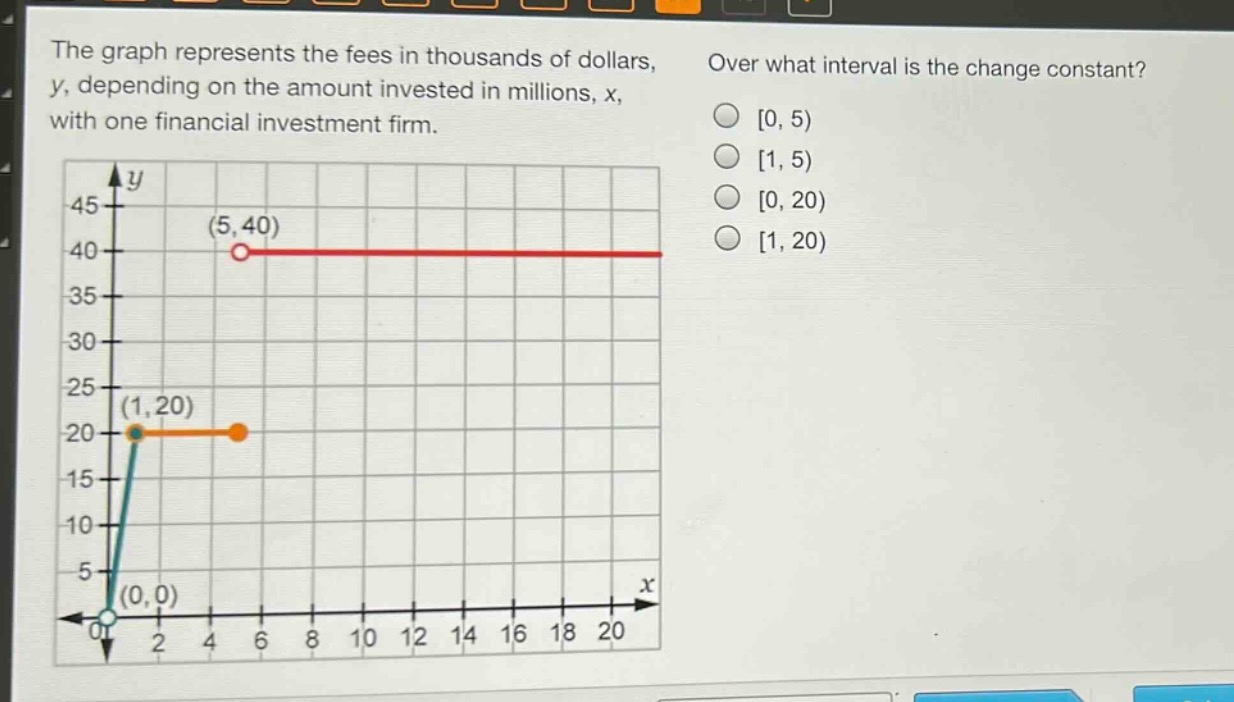
the graph represents the fees in thousands of dollars, y, depending on the amount invested in millions, x, with one financial investment firm. over what interval is the change constant? 0, 5) 1, 5) 0, 20) 1, 20)
Answer
Explanation:
Step1: Recall the concept of constant - change
A function has a constant change over an interval if its graph is a horizontal line over that interval.
Step2: Analyze the given graph
The graph is horizontal from (x = 5) to (x=20). Before (x = 1), the graph is a non - horizontal line (a line with a non - zero slope), and from (x = 1) to (x = 5) the graph is also non - horizontal.
Step3: Determine the interval
The horizontal part of the graph starts at (x = 5) and continues to (x = 20). But looking at the options, the closest interval that contains the horizontal part is ([1,20)) as the function has a non - horizontal part from (x = 0) to (x = 1) and then becomes constant (horizontal) after (x = 5) within the ([1,20)) interval.
Answer:
[1, 20)