the graph shows the average price of homes in the united states from 2009 to 2014. average price of new…
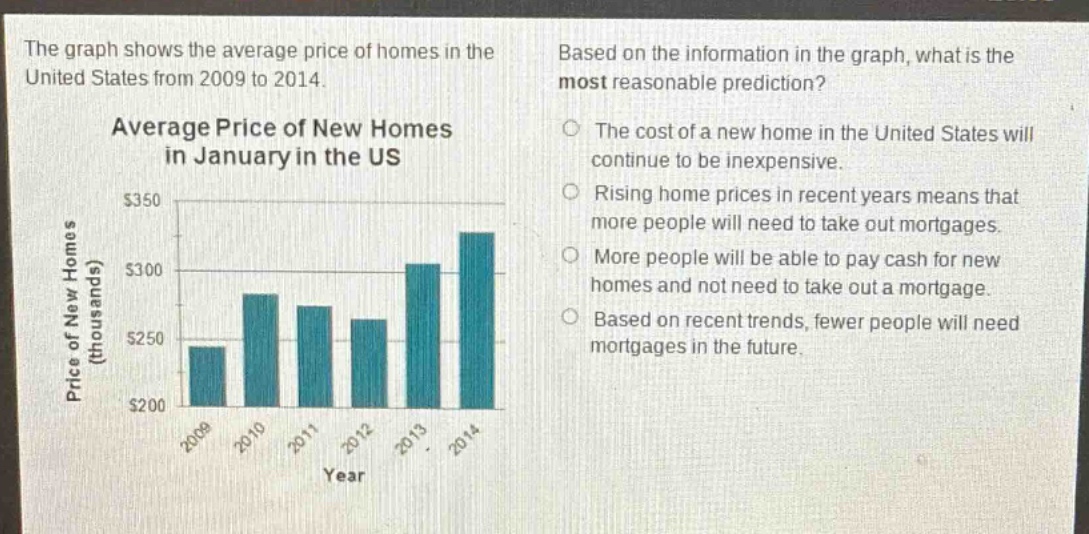
the graph shows the average price of homes in the united states from 2009 to 2014. average price of new homes in january in the us. based on the information in the graph, what is the most reasonable prediction? the cost of a new home in the united states will continue to be inexpensive. rising home prices in recent years means that more people will need to take out mortgages. more people will be able to pay cash for new homes and not need to take out a mortgage. based on recent trends, fewer people will need mortgages in the future.
Answer
Answer:
B. Rising home prices in recent years means that more people will need to take out mortgages.
Explanation:
Step1: Analyze graph trend
The graph shows home - price increase from 2009 - 2014.
Step2: Evaluate each option
A: Prices are rising, not inexpensive. C: Rising prices likely mean fewer can pay cash. D: Rising prices mean more may need mortgages, not fewer. B is consistent with rising - price trend as higher prices may force more to use mortgages.