this graph shows changes in gdp and the unemployment rate in the united states in recent years. annual…
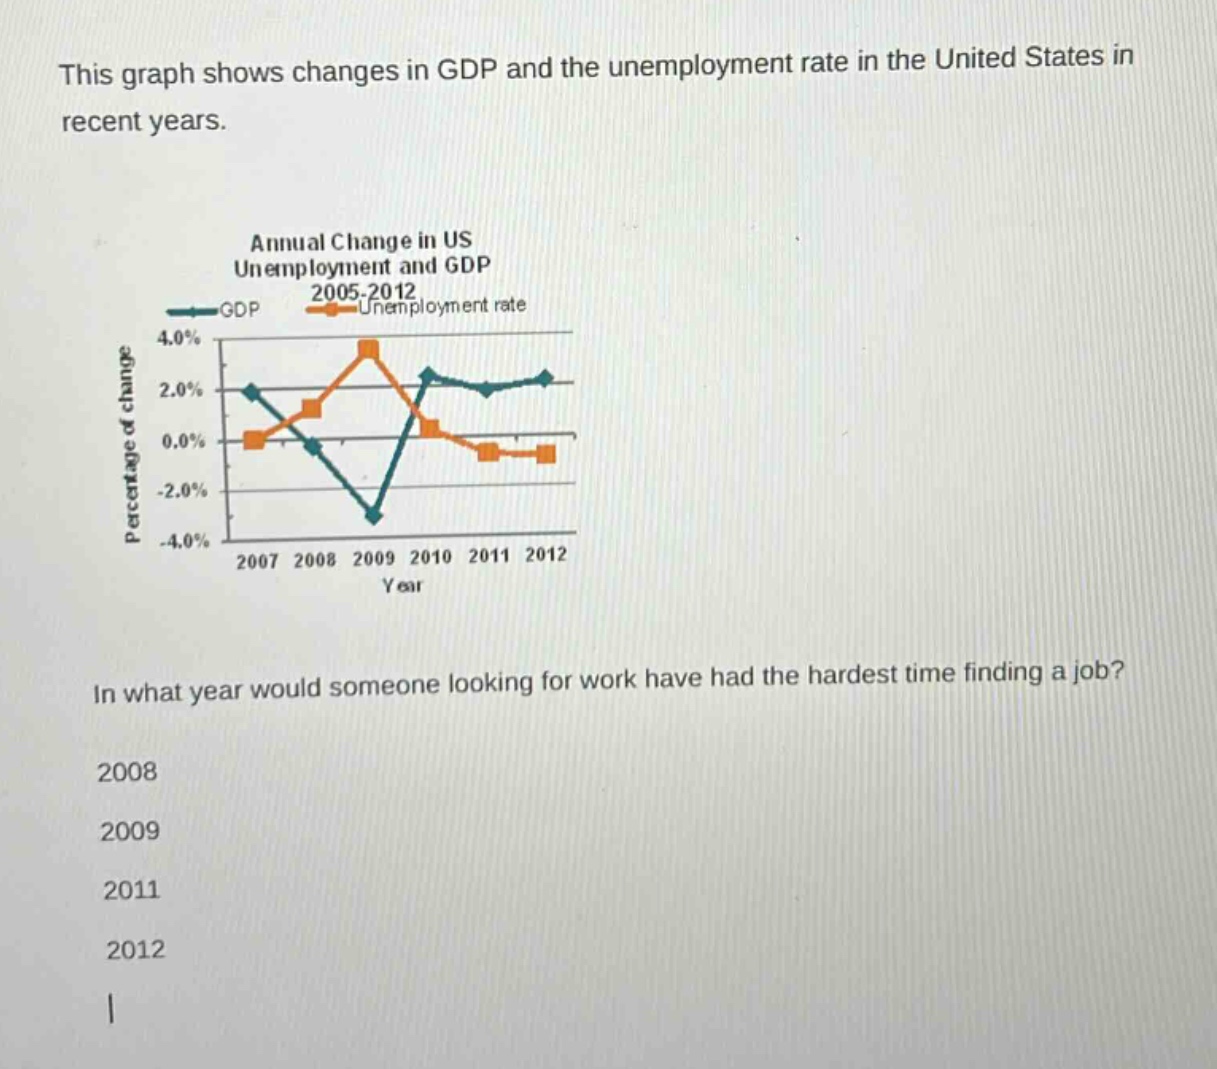
this graph shows changes in gdp and the unemployment rate in the united states in recent years. annual change in us unemployment and gdp 2005 - 2012 gdp unemployment rate percentage of change 4.0% 2.0% 0.0% -2.0% -4.0% 2007 2008 2009 2010 2011 2012 year in what year would someone looking for work have had the hardest time finding a job? 2008 2009 2011 2012
Answer
Brief Explanations:
El año en el que la tasa de desempleo es más alta es cuando alguien tendría más dificultad para encontrar trabajo. Al examinar el gráfico, vemos que la tasa de desempleo alcanza su punto más alto en 2009.
Answer:
2009