this graph shows changes in gross domestic product, which is the value of all goods and services produced in…
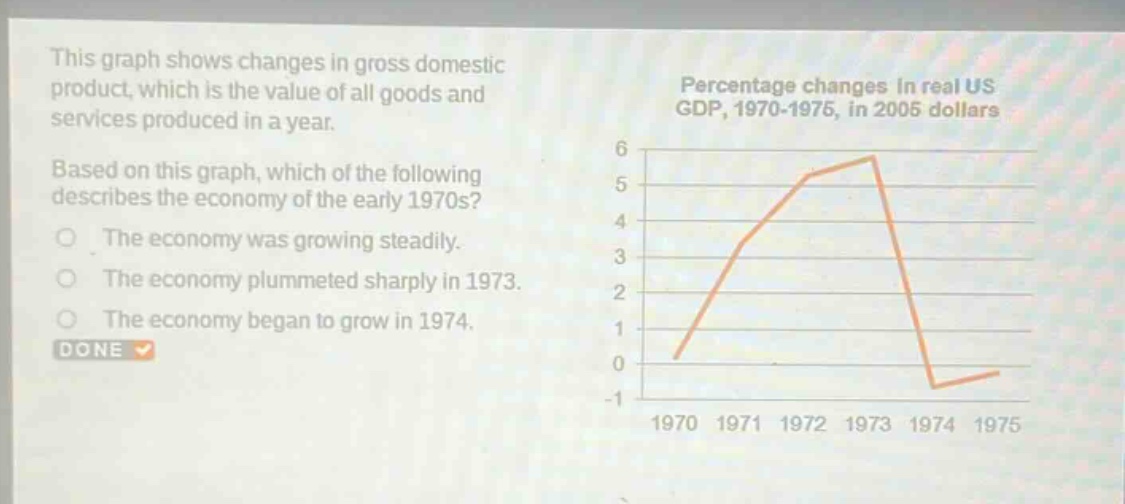
this graph shows changes in gross domestic product, which is the value of all goods and services produced in a year. based on this graph, which of the following describes the economy of the early 1970s? the economy was growing steadily. the economy plummeted sharply in 1973. the economy began to grow in 1974. done
Answer
Answer:
The economy was growing steadily.
Explanation:
Step1: Analyze the graph for the early 1970s.
The graph displays the percentage change in real US GDP from 1970 to 1975. The early 1970s correspond to the period from 1970 to 1973 on the x-axis.
Step2: Observe the GDP growth rates from 1970 to 1973.
In 1970, the growth rate was slightly above 0%. It increased to approximately 3.5% in 1971, further to over 5% in 1972, and peaked near 6% in 1973.
Step3: Evaluate the options based on the observed growth.
The growth rates were consistently positive and generally increasing from 1970 to 1973. This pattern is best described as steady growth, especially compared to the sharp decline in 1974. Option B is incorrect as the plummet occurred in 1974, not 1973. Option C is incorrect as the economy contracted (negative growth) in 1974.