the graph shows changes in interest rates since 1975. average interest rate for a 30 - year, fixed - rate…
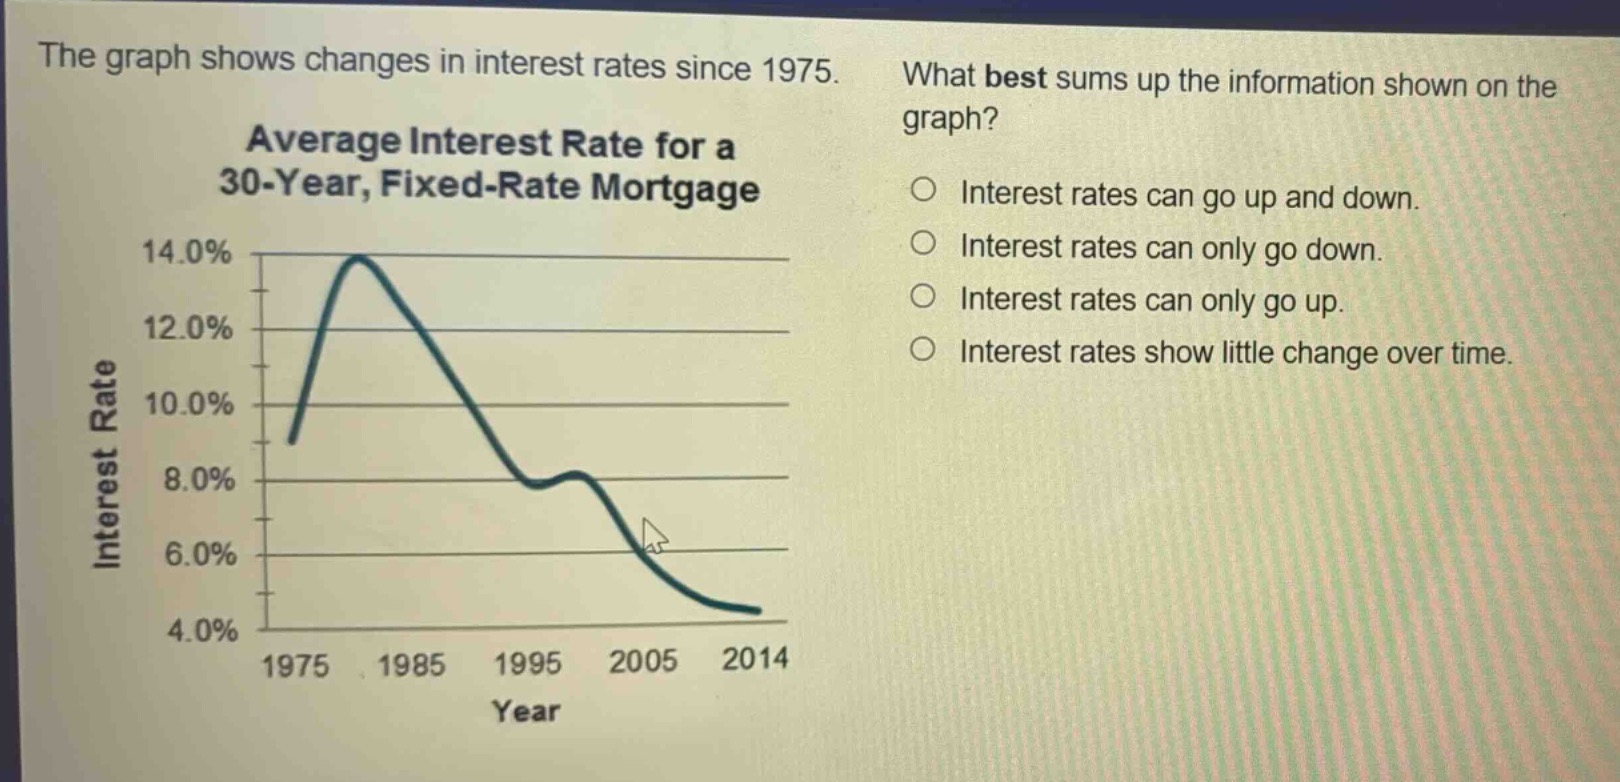
the graph shows changes in interest rates since 1975. average interest rate for a 30 - year, fixed - rate mortgage what best sums up the information shown on the graph? interest rates can go up and down. interest rates can only go down. interest rates can only go up. interest rates show little change over time.
Answer
Answer:
Interest rates can go up and down.
Brief Explanation:
The graph shows rate increases and decreases over time.