the graph shows changes in the us economy between 1971 and 2001. change in us unemployment and inflation…
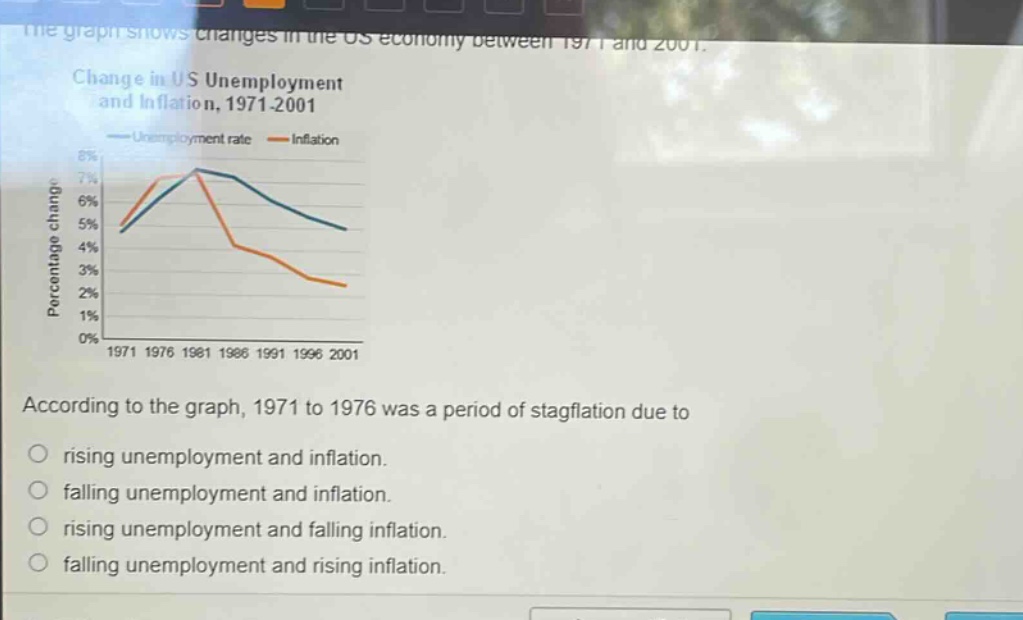
the graph shows changes in the us economy between 1971 and 2001. change in us unemployment and inflation, 1971 - 2001 unemployment rate inflation percentage change 8% 7% 6% 5% 4% 3% 2% 1% 0% 1971 1976 1981 1986 1991 1996 2001 according to the graph, 1971 to 1976 was a period of stagflation due to rising unemployment and inflation. falling unemployment and inflation. rising unemployment and falling inflation. falling unemployment and rising inflation.
Answer
Brief Explanations:
Stagflation is characterized by high - inflation and high - unemployment. Looking at the graph for 1971 - 1976, both the unemployment rate (blue line) and the inflation rate (orange line) are rising.
Answer:
rising unemployment and inflation.