this graph shows the changing unemployment rate in the united states. based on this graph, what can be…
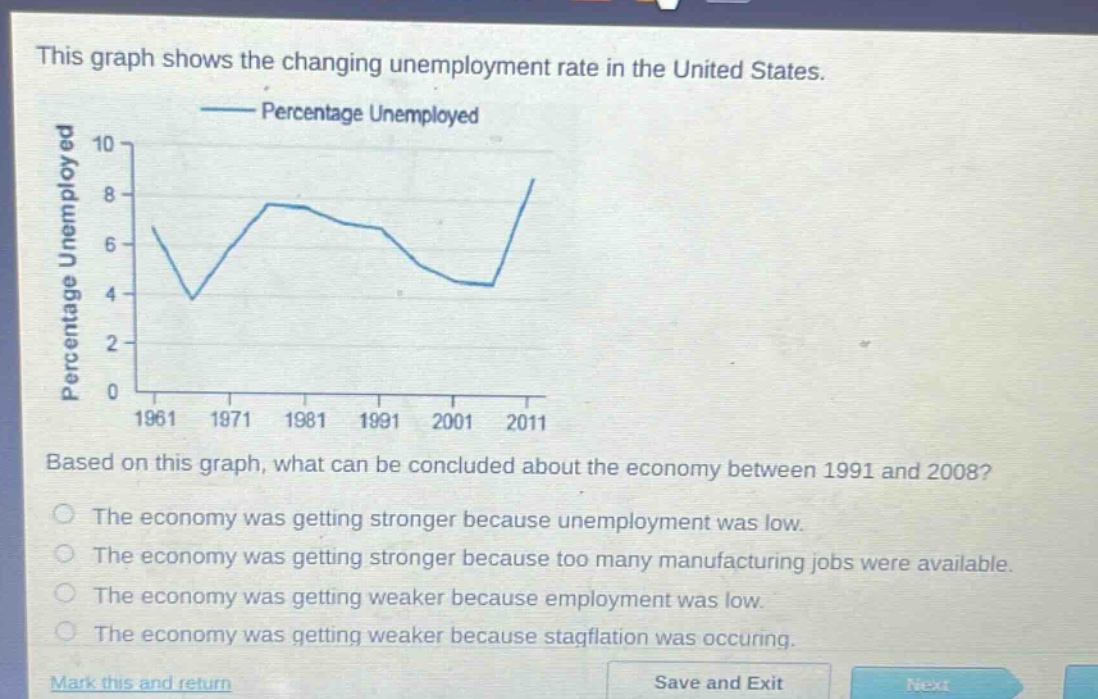
this graph shows the changing unemployment rate in the united states. based on this graph, what can be concluded about the economy between 1991 and 2008? the economy was getting stronger because unemployment was low. the economy was getting stronger because too many manufacturing jobs were available. the economy was getting weaker because employment was low. the economy was getting weaker because stagflation was occurring.
Answer
Brief Explanations:
Unemployment rate is an important indicator of economic health. Lower unemployment generally indicates a stronger economy. From the graph, between 1991 - 2008, the unemployment rate was relatively low and decreasing in some periods, suggesting economic strength. Manufacturing jobs availability isn't indicated by the graph. Low employment would mean high unemployment which isn't the case here. There is no indication of stagflation (stagnation + inflation) from the graph.
Answer:
The economy was getting stronger because unemployment was low.