this graph shows the changing unemployment rate in the united states. percentage unemployed from 2001 to…
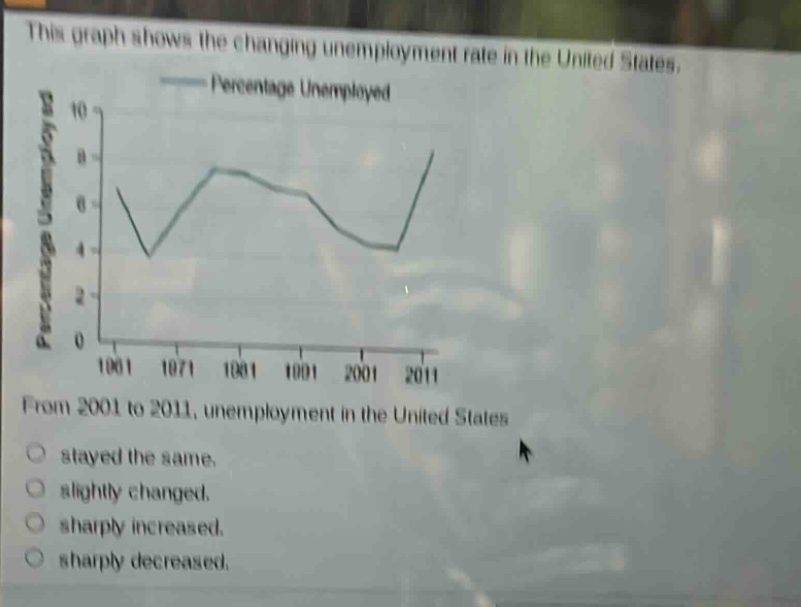
this graph shows the changing unemployment rate in the united states. percentage unemployed from 2001 to 2011, unemployment in the united states stayed the same. slightly changed. sharply increased. sharply decreased.
Answer
Brief Explanations:
By observing the graph, the unemployment - rate line rises steeply from 2001 to 2011.
Answer:
sharply increased.