this graph shows the cost of health care per every american citizen each year. which statement does this…
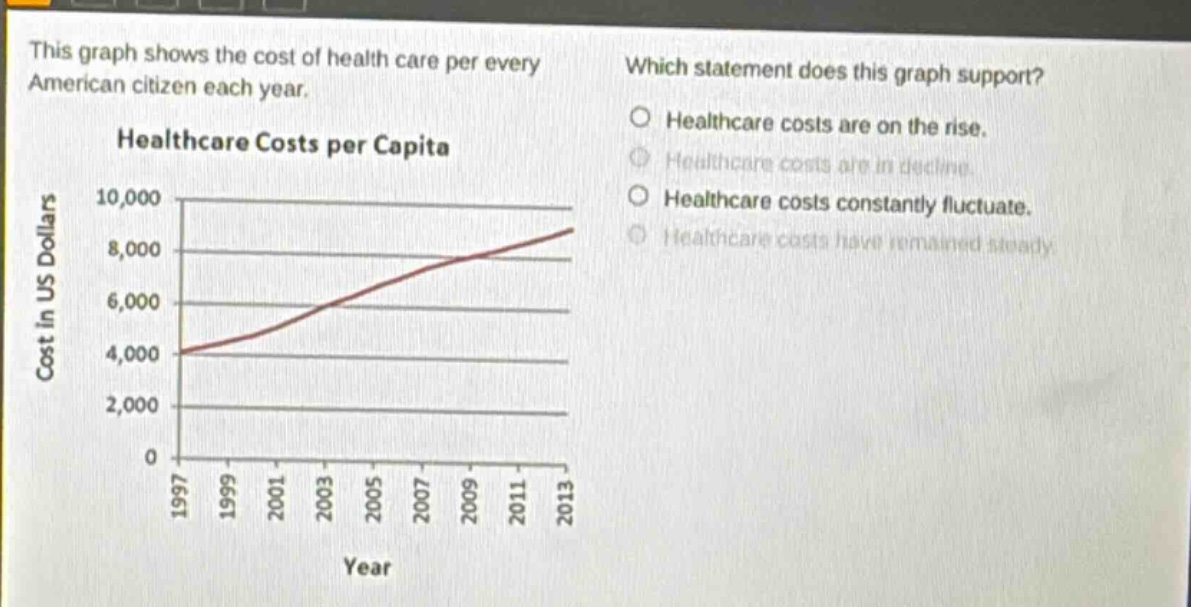
this graph shows the cost of health care per every american citizen each year. which statement does this graph support? healthcare costs are on the rise. healthcare costs are in decline. healthcare costs constantly fluctuate. healthcare costs have remained steady. healthcare costs per capita cost in us dollars 10,000 8,000 6,000 4,000 2,000 0 1997 1999 2001 2003 2005 2007 2009 2011 2013 year
Answer
Answer:
Healthcare costs are on the rise.
Explanation:
Step1: Observe the graph trend
The line graph shows an upward - sloping trend from 1997 to 2013. As the years progress, the cost in US dollars per capita increases. So, healthcare costs are on the rise.