the graph shows data for the years 2010 through 2012.\ntotal merchandise exports (2010 - 2012)\nwhich might…
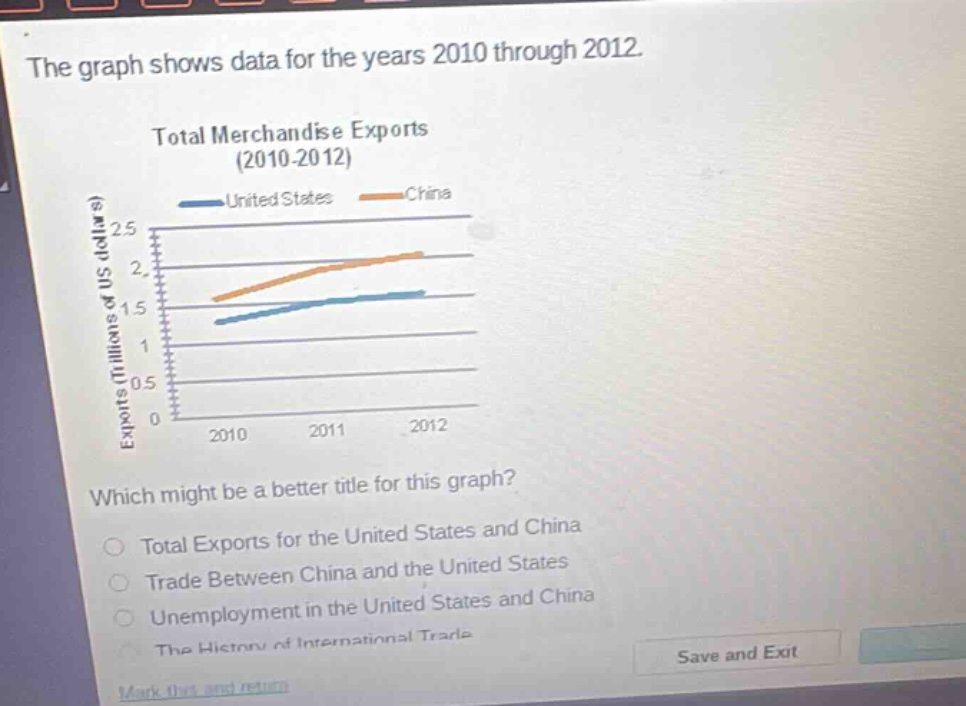
the graph shows data for the years 2010 through 2012.\ntotal merchandise exports (2010 - 2012)\nwhich might be a better title for this graph?\ntotal exports for the united states and china\ntrade between china and the united states\nunemployment in the united states and china\nthe history of international trade
Answer
Brief Explanations:
The graph shows total merchandise exports of the US and China from 2010 - 2012. The best - fitting title should reflect this data. The first option is about total exports of the two countries which matches the graph content. The second option is too general about trade (imports and exports not just exports). The third option is about unemployment which is not related to the graph. The fourth option is about the history of international trade which is too broad.
Answer:
Total Exports for the United States and China