on a graph, a(n) shows the demand portion of equilibrium. demand curve supply curve equilibrium point excess…
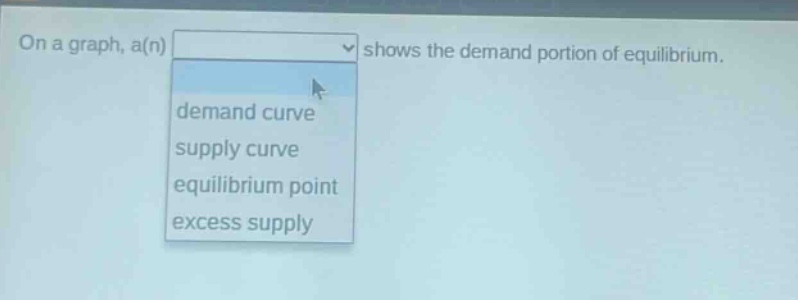
on a graph, a(n) shows the demand portion of equilibrium. demand curve supply curve equilibrium point excess supply
Answer
Answer:
demand curve
Brief Explanations:
In economic graphs, the demand curve represents the demand - side of market equilibrium. It shows the quantity of a good or service that consumers are willing and able to buy at various prices.