the graph shows employment figures for nonfarm workers for 2008 to 2013. what problem does this graph…
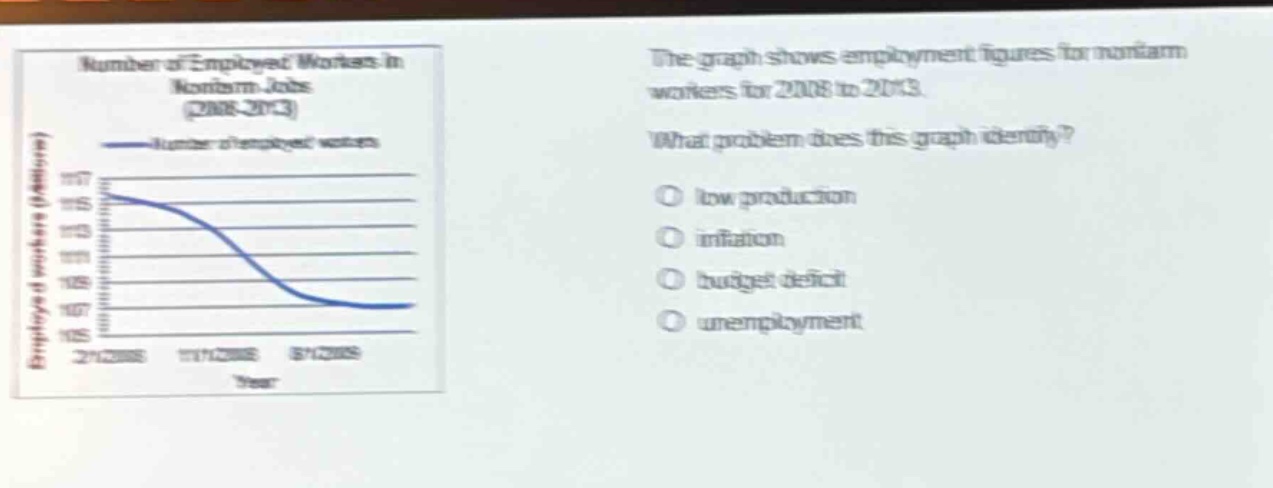
the graph shows employment figures for nonfarm workers for 2008 to 2013. what problem does this graph identify? low production inflation budget deficit unemployment
Answer
Brief Explanations:
The graph shows the number of employed workers in nonfarm jobs over time. A decline in the number of employed workers indicates a rise in unemployment. Low - production, inflation, and budget deficit are not directly related to the data presented which is focused on employment figures.
Answer:
unemployment