the graph shows the estimated value of a piece of land, where x is the number of years since the purchase…
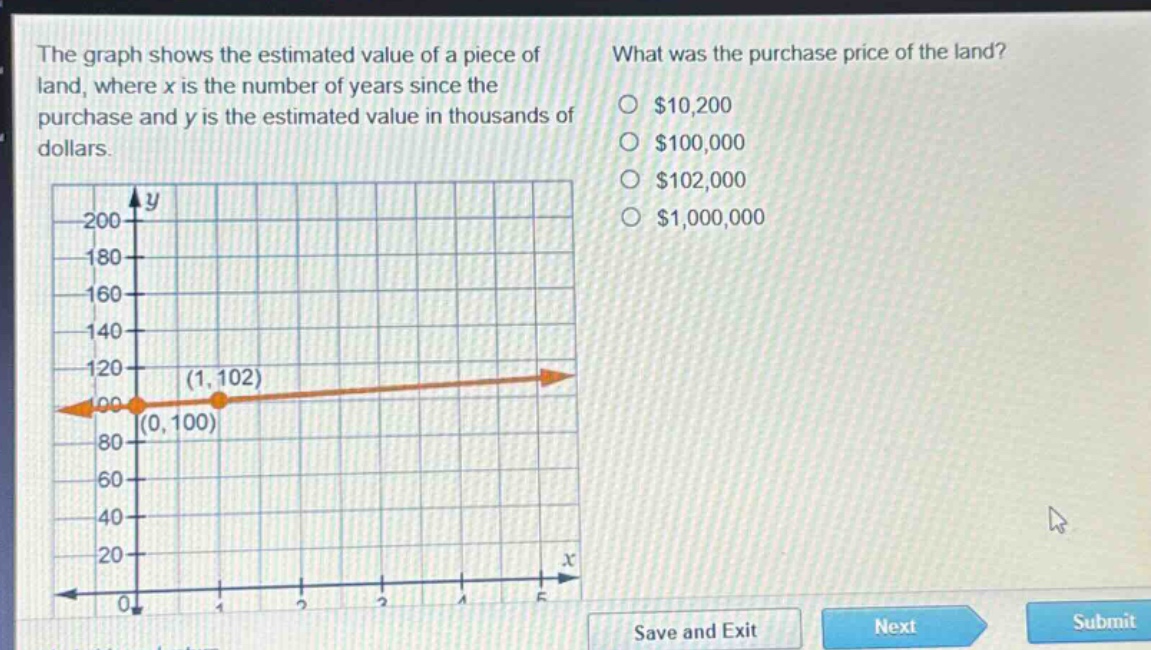
the graph shows the estimated value of a piece of land, where x is the number of years since the purchase and y is the estimated value in thousands of dollars. what was the purchase price of the land? $10,200 $100,000 $102,000 $1,000,000 (1, 102) (0, 100)
Answer
Explanation:
Step1: Identify variables and their meanings.
The variable $x$ represents the number of years since the purchase. The variable $y$ represents the estimated value of the land in thousands of dollars.
Step2: Determine the value of $x$ at purchase.
The purchase price is the value of the land at the time of purchase. At this time, the number of years since purchase, $x$, is 0.
Step3: Find the $y$-value at $x=0$.
From the graph, the point corresponding to $x=0$ is $(0, 100)$. Thus, when $x=0$, $y=100$.
Step4: Convert the $y$-value to dollars.
The $y$-value is given in thousands of dollars. So, $y=100$ means the value is $100 \text{ thousand dollars}$. $$ \text{Purchase Price} = 100 \times $1,000 $$
Step5: Calculate the purchase price.
$$ \text{Purchase Price} = $100,000 $$
Answer:
B. $100,000