the graph shows how the federal budget grew between 1980 and 2010. us government revenue and expenditures…
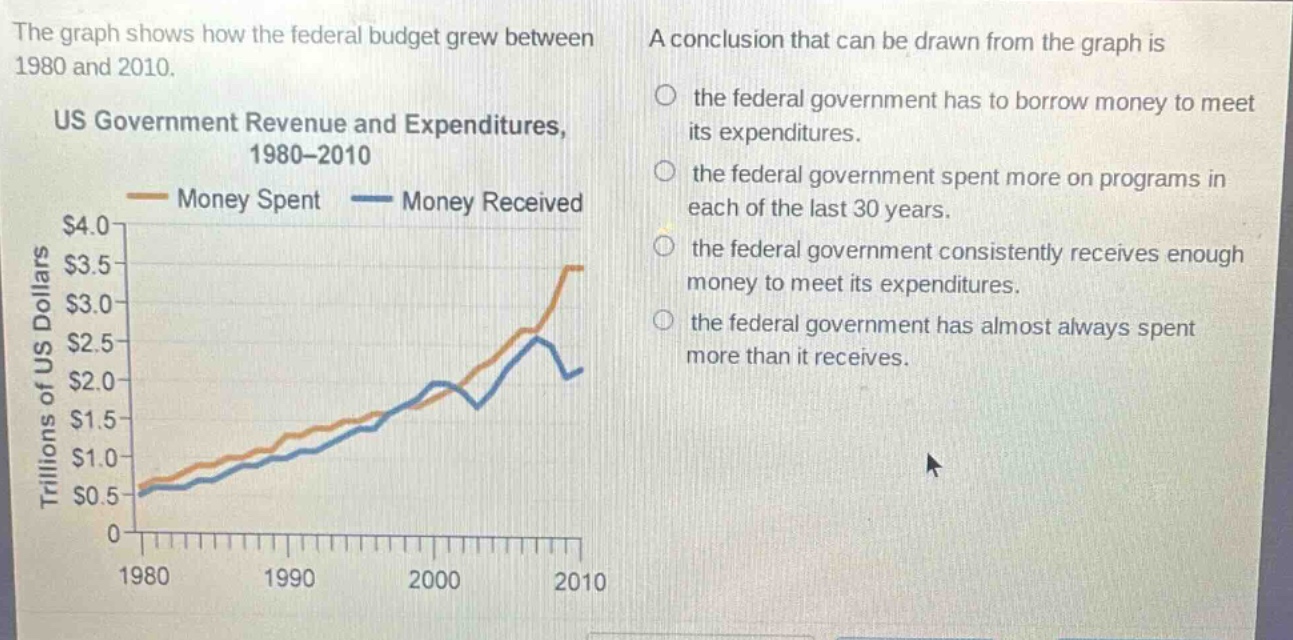
the graph shows how the federal budget grew between 1980 and 2010. us government revenue and expenditures, 1980 - 2010 money spent money received a conclusion that can be drawn from the graph is the federal government has to borrow money to meet its expenditures. the federal government spent more on programs in each of the last 30 years. the federal government consistently receives enough money to meet its expenditures. the federal government has almost always spent more than it receives.
Answer
Brief Explanations:
Al observar la gráfica, la línea de dinero gastado (en naranja) está por encima de la línea de dinero recibido (en azul) en la mayoría de los años entre 1980 y 2010. Esto significa que el gobierno federal ha gastado más de lo que ha recibido en la mayoría de los años.
Answer:
D. the federal government has almost always spent more than it receives.