the graph shows gross domestic product in the us private sector from 2009 to 2017. based on the graph, what…
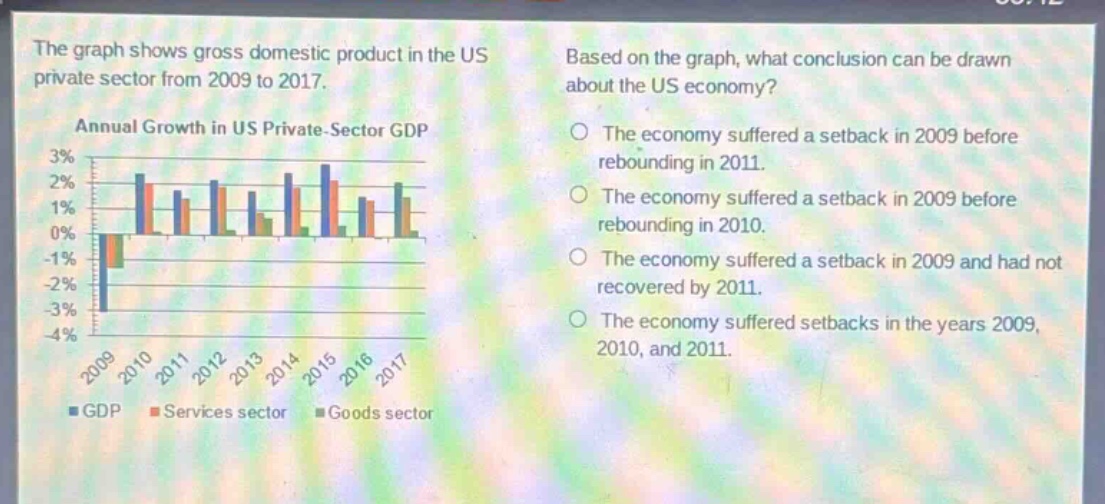
the graph shows gross domestic product in the us private sector from 2009 to 2017. based on the graph, what conclusion can be drawn about the us economy? annual growth in us private - sector gdp the economy suffered a setback in 2009 before rebounding in 2011. the economy suffered a setback in 2009 before rebounding in 2010. the economy suffered a setback in 2009 and had not recovered by 2011. the economy suffered setbacks in the years 2009, 2010, and 2011.
Answer
Brief Explanation:
By observing the graph, in 2009 the growth rate of US private - sector GDP is negative, indicating a setback. The growth rate turns positive in 2010, showing a rebound.
Answer:
The economy suffered a setback in 2009 before rebounding in 2010.