the graph shows the growth of national income in the soviet union between 1960 and 1985. what does the graph…
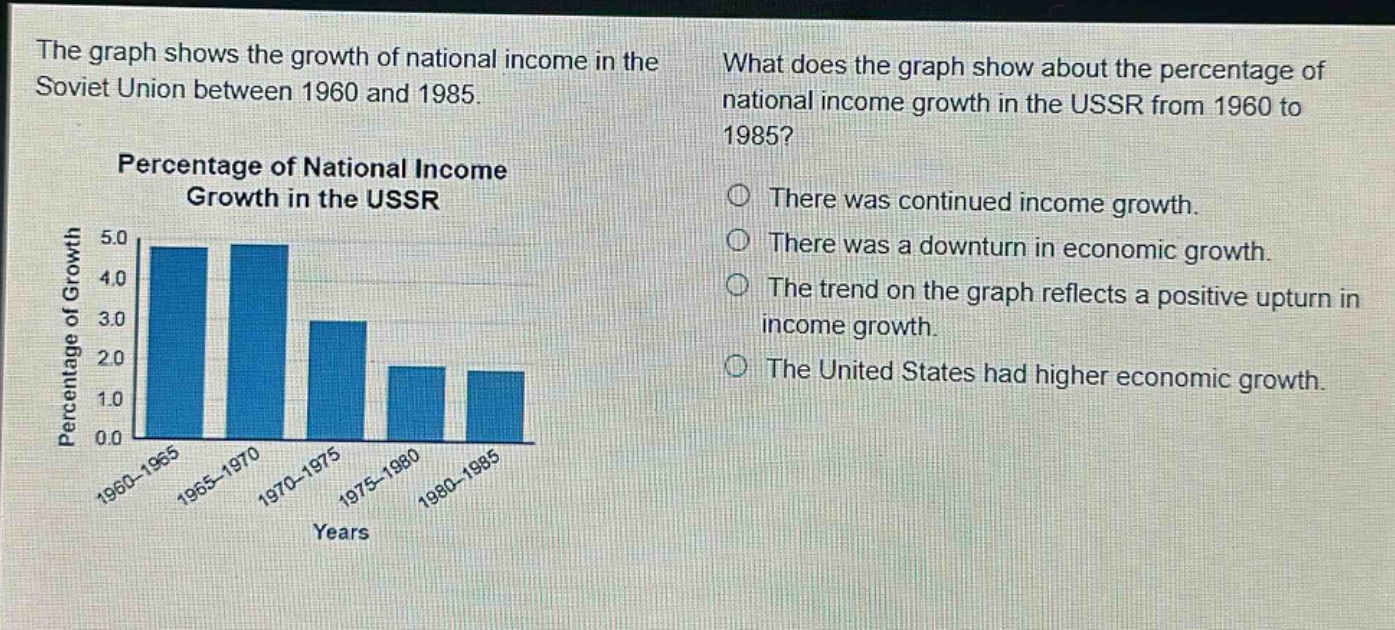
the graph shows the growth of national income in the soviet union between 1960 and 1985. what does the graph show about the percentage of national income growth in the ussr from 1960 to 1985? percentage of national income growth in the ussr there was continued income growth. there was a downturn in economic growth. the trend on the graph reflects a positive upturn in income growth. the united states had higher economic growth. years
Answer
Answer:
There was a downturn in economic growth.
Brief Explanations:
The bar - graph shows that the percentage of national income growth in the USSR decreased from 1960 - 1965 to 1980 - 1985, indicating a downturn in economic growth.