the graph shows keyness theory of aggregate demand. what is likely to happen if a new aggregate demand curve…
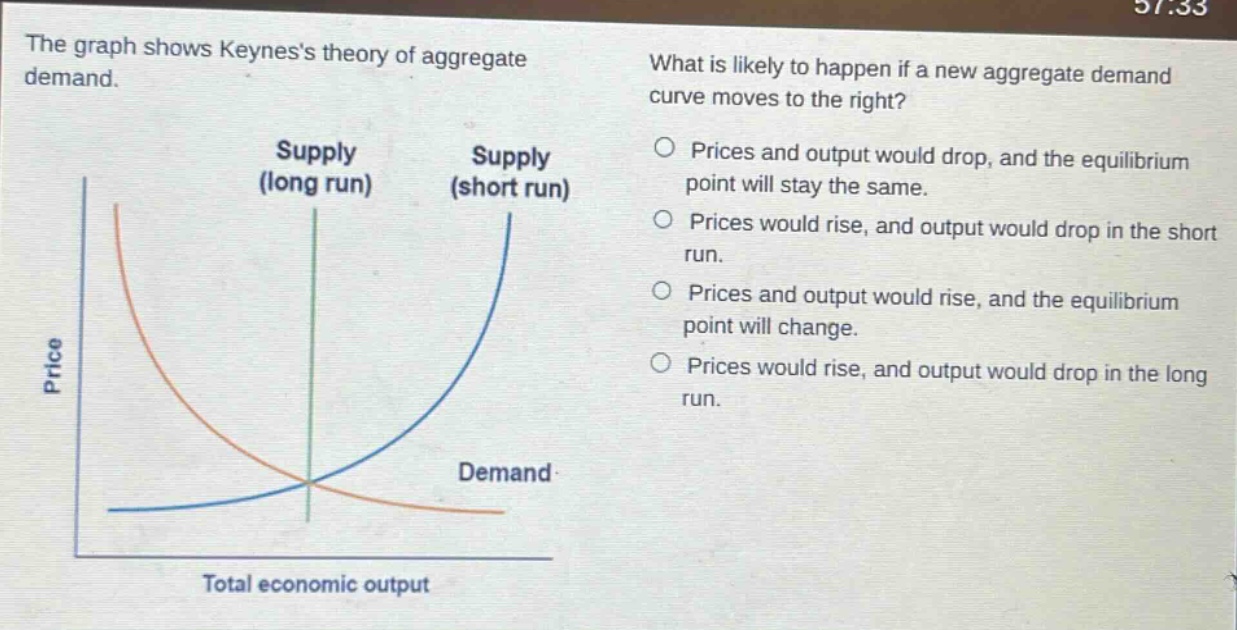
the graph shows keyness theory of aggregate demand. what is likely to happen if a new aggregate demand curve moves to the right? prices and output would drop, and the equilibrium point will stay the same. prices would rise, and output would drop in the short run. prices and output would rise, and the equilibrium point will change. prices would rise, and output would drop in the long run.
Answer
Brief Explanations:
In Keynesian economics, when the aggregate - demand curve shifts to the right, it indicates an increase in demand. In the short - run, firms respond to this increased demand by increasing output and raising prices. In the long - run, the economy moves to a new equilibrium. The new equilibrium point will change as both the price level and the output level increase.
Answer:
Prices and output would rise, and the equilibrium point will change.