this graph shows merchandise export data for the years 2010 through 2012. total merchandise exports (2010…
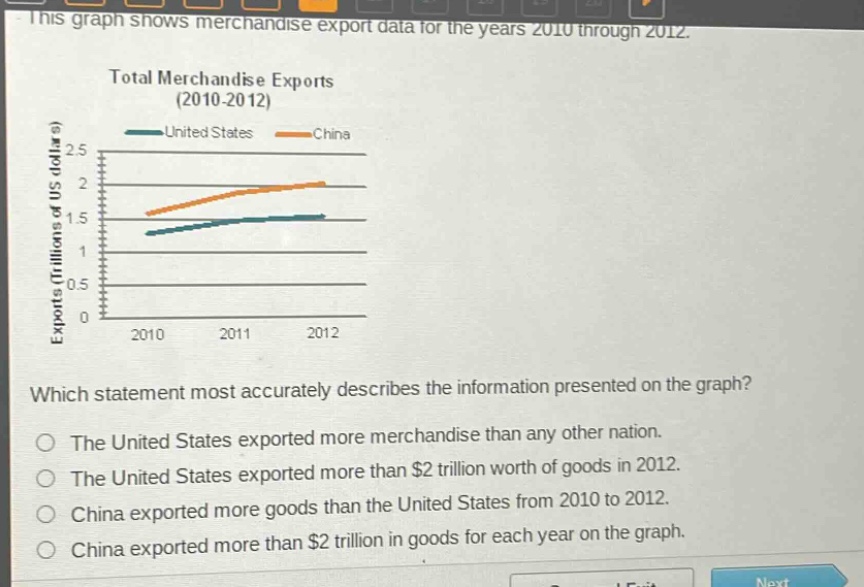
this graph shows merchandise export data for the years 2010 through 2012. total merchandise exports (2010 - 2012) exports (trillions of us dollars) united states china 2.5 2 1.5 1 0.5 0 2010 2011 2012 which statement most accurately describes the information presented on the graph? the united states exported more merchandise than any other nation. the united states exported more than $2 trillion worth of goods in 2012. china exported more goods than the united states from 2010 to 2012. china exported more than $2 trillion in goods for each year on the graph.
Answer
Explanation:
Step1: Analyze option 1
Graph only shows US and China, not all nations.
Step2: Analyze option 2
US exports in 2012 are below 1.5 trillion.
Step3: Analyze option 3
China's export line is above US line from 2010 - 2012.
Step4: Analyze option 4
China's exports are around 2 trillion in 2012, not above 2 trillion each year.
Answer:
China exported more goods than the United States from 2010 to 2012.