the graph shows the number of employed workers in the united states in nonfarm jobs from 2008 to 2013. which…
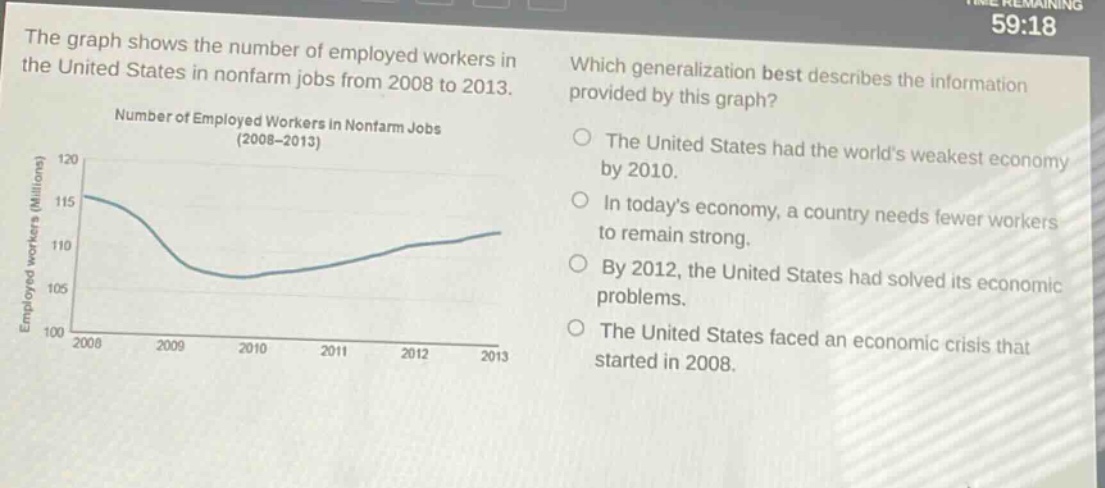
the graph shows the number of employed workers in the united states in nonfarm jobs from 2008 to 2013. which generalization best describes the information provided by this graph? the united states had the worlds weakest economy by 2010. in todays economy, a country needs fewer workers to remain strong. by 2012, the united states had solved its economic problems. the united states faced an economic crisis that started in 2008.
Answer
Brief Explanations:
The graph shows a decline in non - farm employed workers starting from 2008, which is indicative of an economic crisis. There is no information about the world's economy, the general need for fewer workers in today's economy, or the resolution of economic problems by 2012.
Answer:
The United States faced an economic crisis that started in 2008.