the graph shows the percentage changes in the investment rate and the gross domestic product (gdp) between…
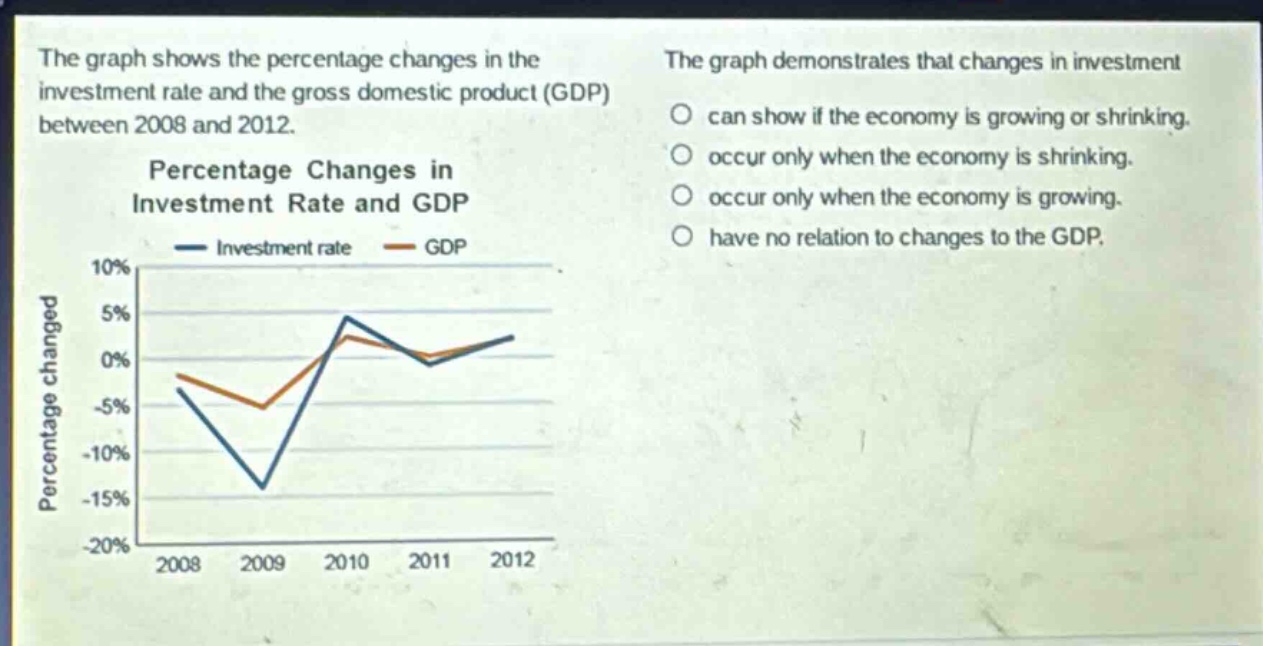
the graph shows the percentage changes in the investment rate and the gross domestic product (gdp) between 2008 and 2012. percentage changes in investment rate and gdp the graph demonstrates that changes in investment can show if the economy is growing or shrinking. occur only when the economy is shrinking. occur only when the economy is growing. have no relation to changes to the gdp.
Answer
Brief Explanations:
Investment rate and GDP are key economic indicators. Positive percentage - changes in GDP generally indicate economic growth, and changes in investment rate can influence and reflect the state of the economy. From the graph, we can see that fluctuations in the investment rate and GDP are related and can show the economic growth or shrinkage status.
Answer:
can show if the economy is growing or shrinking.