the graph shows us trade with china from 1990 to 2018. us trade with china (1985 - 2019) exports to china…
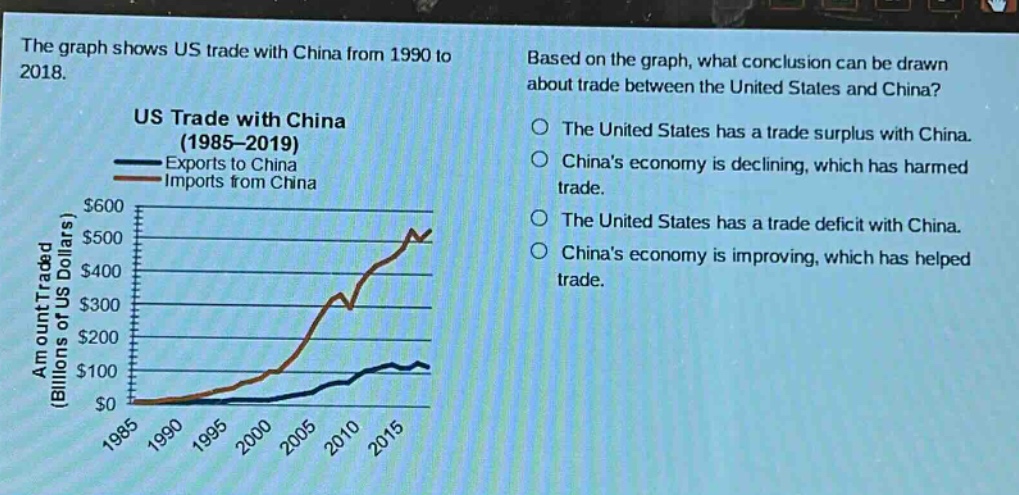
the graph shows us trade with china from 1990 to 2018. us trade with china (1985 - 2019) exports to china imports from china based on the graph, what conclusion can be drawn about trade between the united states and china? the united states has a trade surplus with china. chinas economy is declining, which has harmed trade. the united states has a trade deficit with china. chinas economy is improving, which has helped trade.
Answer
Brief Explanations:
By observing the graph, the value of US imports from China (red - line) is consistently higher than the value of US exports to China (blue - line) over the period. A trade deficit occurs when imports exceed exports.
Answer:
The United States has a trade deficit with China.