the graph below shows the value of the us dollar versus the canadian dollar. according to the graph, the…
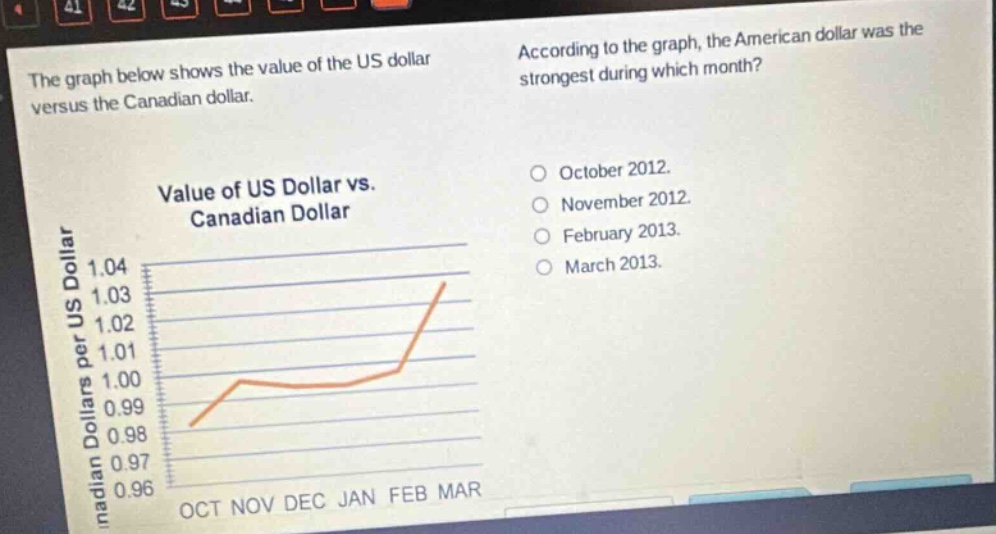
the graph below shows the value of the us dollar versus the canadian dollar. according to the graph, the american dollar was the strongest during which month? value of us dollar vs. canadian dollar october 2012. november 2012. february 2013. march 2013.
Answer
Explanation:
Step1: Understand the graph
The y - axis represents the value of the US dollar per Canadian dollar. A higher value means a stronger US dollar.
Step2: Identify the highest point
We look for the highest point on the graph in the given time - period. The highest value of the US dollar per Canadian dollar occurs in March 2013.
Answer:
March 2013